
Page 89 - 2019_12-Haematologica-web
P. 89
Somatic variants in CML-CP as predictive biomarker
A
BC
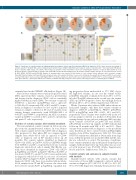
Figure 1. Landscape of somatic variants in individuals with chronic-phase chronic myeloid leukemia (CML-CP) at diagnosis. (A) Pie charts show the percentage of somatic variants in imatinib (IM)- and second-generation tyrosine kinase inhibitor (2G-TKI)-treated subjects and per responders (R) + non-responders (NR) group. Gray: no variants; light orange: one variant; dark orange: ≥2 variants. P-value from Fisher’s exact test comparing the incidence of subjects with variants (1 or ≥2 grouped together), compared with no variants, in R versus NR from the IM and 2G-TKI groups. (B) Somatic variants number and type in each patient (n=37) sorted in IM-R, IM-NR, 2G-TKI-R and 2G-TKI-NR. Number of variants/subject are reported at the bottom of each column. Yellow: missense; blue: nonsense; orange: frameshift insertions; gray: non-frameshift deletions; green: splice-site variants. Intensities of each color cell indicate the variant allele frequency (VAF) of each somat- ic variant with darker colors associated with higher VAF. Pre-leukemia variants are depicted in boxes in dashed lines, COSMIC with “C” and 2 variants affecting the same gene with “2x”. (C) Bar plots indicate the number of variants affecting each gene. Genes (rows) ordered by prevalence of variants/gene in CML-CP.
currently listed in the COSMIC v86 database (Figure 1B). None of these variants were found in the paired-control DNA, apart from three variants, classed as pre-leukemia and detected in the diagnostic CD34+ cells at a markedly higher VAF than in control DNA. Two variants occurred in DNMT3A: a missense (p.Arg899Gly) and a splice-site (c.1123-2A>G) variant with VAF of 50% and 48%, respec- tively, at diagnosis, but reduced to 22% and 6% in paired remission samples collected at 55 and 47 months from starting therapy, respectively (with BCRABL1/ABL1 of 0.0012% and 0.0009%, respectively). An ASXL1 nonsense variant (p.Tyr591*) occurred at 52% and 16% in leukemia
and paired T cells, respectively.
Evolution of somatic variants after imatinib treatment
We next examined somatic variants in follow-up sam- ples from the imatinib-treated subjects. In four subjects with somatic variants detected in CD34+ cells at diagnosis who progressed to blast phase (BP) we compared paired samples from whole-blood cells (as opposed to CD34+ cells) at diagnosis and in BP (median follow up 25 months). The somatic variants identified in diagnostic CD34+ cells (ASXL1 p.Gln780*, ASXL1 p.Gln594fs) at high level (VAF 51% and 40%, respectively) were also found in diagnostic whole-blood cells at similar VAF. On the con- trary, those identified in diagnostic CD34+ cells (IKZF1 p.Arg184Trp and IKZF1 p.Arg213*/ IKZF1 p.Tyr348*) at low levels (VAF 5.9%, and 6.9%/4.9%) were undetectable in diagnostic whole-blood cells. In one case of low-level variants (IKZF1 p.Arg213*/ IKZF1 p.Tyr348*) identified in diagnostic CD34+ cells, these were undetectable in whole- blood samples from CP and BP; however, the clone with the low-level variant IKZF1 p.Arg184Trp, expanded dur-
ing progression (from undetectable to 17% VAF). As for the high-level variants, in one case the variant ASXL1 p.Gln594fs remained at similar levels (from 40% to 43%) in both CP and BP, whereas in the second case, the variant ASXL1 p.Gln780* dropped to lower, but still high, levels in BP (from 45% to 27%) (Online Supplementary Table S2).
Of the 11 patients who achieved MR3 and in whom we had paired samples, only three had somatic variants at diagnosis (KMT2D p.Gln3946Leu, PRMT9 p.Phe591fs, IKZF1 p.Arg184Trp) with VAF of 54%, 42% and 16%, respectively. These variants were undetectable in the fol- low-up samples collected at a median of 20 months from starting therapy. In two subjects achieving MR3 we iden- tified variants (DNMT3A p.Cys497Tyr and EHMT2 p.Pro196Gln) in follow-up samples in MR3 with median follow-up 18 months with VAF of 5% and 10%. These variants were undetectable at diagnosis, so the possibility arises that they are due to clonal evolution in Philadelphia negative clone (Online Supplementary Table S2). The same DNMT3A variant was identified at 141 months from diag- nosis, when the patient was in durable MR4 and the sam- ple was collected as a control. The presence of eight mis- sense variants identified only in the paired deep remission samples (with median follow up 72 months) was associat- ed with increased age (P=0.029) (Online Supplementary Results and Online Supplementary Table S3).
Somatic variants and outcomes in subjects treated with imatinib
Imatinib-treated subjects with somatic variants had lower rates of 5-year MR3 compared to subjects without variants at diagnosis [47% (95%CI: 11, 68%) vs. 94% (67, 99%); P=0.048) (Figure 2A). Similarly they had lower rates
haematologica | 2019; 104(12)
2403
