
Page 88 - 2019_12-Haematologica-web
P. 88
G. Nteliopoulos et al.
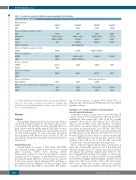
Table 1. Seventy-one epigenetic modifiers grouped according to gene function. 71 epigenetic modifying genes
DNA methylation
DNMT1
TET1
Histone methylation at lysine residues
EZH2
KMT2A(MLL)
EHMT2
DOT1L
KMT5B (SUV420H1)
Histone methylation at arginine residues
PRMT2
Histone demethylation
KDM3B
JMJD6
Histone acetylation
CREBBP
NCOA3
Histone deacetylation
HDAC1
SIRT2
Histone ubiquitination
RNF2 (RING1B)
Other genes (transcription factors, signaling molecules) RUNX1
NPM1
DNMT3A TET2
SUZ12 KMT2B (MLL4) KMT5A (SETD8) AFF1
PRMT3
KDM5B
JMJD8
EP300 ATF2
HDAC2
BAP1
WT1
PHF6
DNMT3B IDH1
EED KMT2D (MLL2) SUV39H1 SETDB1 NSD3 (WHSC1L1)
PRMT6
KDM1A (LSD1)
KDM5C (JARID1C) KAT2A
HDAC6
BMI1
IKZF1
BCOR
TRDMT1 IDH2
ASXL1 KMT2E (MLL5) SMYD2 SETDB2
PRMT9 (PRMT10)
KDM6A
KAT6A
HDAC7
Histone phosphorylation
AURKB
SET (2PP2A)
BRD1
DNMT3L IDH3B
SETD2 SETD1A NSD1 SETD3
KDM4C
HAT1
SIRT1
SETBP1
CALR
see Online Supplementary Methods). Logistic regression and Fisher’s exact test were used to calculate associations of variables and probability of greater-than-random overlaps, respectively. P<0.05 were considered significant.
Results
Subjects
Demographic, clinical and molecular data of the subjects are shown in Table 2. Sixty-two, 55, 4 and 3 subjects start- ed treatment with imatinib, dasatinib, nilotinib and bosu- tinib. Subjects treated initially with 2G-TKI did so because they were enrolled in clinical trials. Among subjects treat- ed with initial imatinib, 33 were responders (R) and 29 non-responders (NR). Of those who received 2G-TKI, 36 and 26 were classified as responders and non-responders, respectively.
Sequencing data
A mean depth of coverage of 302x (range: 85x-1088x) was achieved yielding a limit of detection of 4% variant allele frequency (VAF). After filtering (Online Supplementary Figure S3), 142 non-synonymous variants remained (in 51 of 71 genes), of which 43 were somatical- ly acquired variants. Of these, 40 were classed as somatic if they were present only in leukemia DNA, and three as pre-leukemia (before BCRABL1) if VAF in leukemia DNA was >20% greater than VAF in control DNA. The remain-
ing 99 were present at similar VAF (about 50%) in leukemia and control/matched DNA and were most likely germline variants.
Incidence of somatic variants in chronic-phase chronic myeloid leukemia
Forty-three somatic variants were observed 49 times (5 variants >1) in 37 of 124 subjects [30% (95%CI: 23, 39%)], including 18 of 62 subjects [29%, (95%CI:20, 43%)] in the imatinib cohort and 19 of 62 subjects [31% (95%CI:21, 45%)] in the 2G-TKI cohort. The incidence of subjects with at least one somatic variant (1 or ≥2 grouped together) was higher in non-responders [22 of 55; 40% (95%CI:28, 53%)] compared with responders from both imatinib- and 2G-TKI-treated cohorts [15 of 69; 22% (95%CI: 14, 33%); P=0.031) (Figure 1A). More than one somatic variant in the same or different genes was seen in three subjects in the imatinib cohort and in six of the 2G-TKI cohort and occurred more often in non-responders (Figure 1A).
Most of the 49 variants (26 missense, 14 nonsense, 3 splice-site, 5 frameshift insertions and 1 non-frameshift deletion) identified in 21 of 71 genes were in non-respon- ders (Figure 1B and Online Supplementary Table S1). The most frequently altered genes were ASXL1 (n=10 in 9 sub- jects), IKZF1 (n=6 in 4 subjects), DNMT3A and CREBBP (n=4), KMT2D (MLL2), KMT2E (MLL5), and EP300 (n=3) (Figure 1C). VAF were 4.6-64% and for 28 of 49 variants were <20% (Figure 1B). In three subjects, two variants occurred in the same gene. Fifteen of 43 variants (35%) are
2402
haematologica | 2019; 104(12)
