
Page 80 - 2019_12-Haematologica-web
P. 80
A. Ferrari et al.
across studies; the final meta-analysis was conducted on a total of 3,236 patients in whom HU therapy was consis- tently administered. Follow-up duration ranged from 0.3 to 12.4 years.
Quality of studies was judged using the JBI critical appraisal tool for prevalence studies considering sample size, representativeness of the sample, sampling methods, objectively measured outcomes, and adequate informa- tion on follow-up duration and potential confounders.
Only two studies in our review, both by Alvarez-Larràn
et al.,7,21 were specifically aimed at obtaining incidence esti-
mates under HU treatment, and thus fully met these crite-
ria. The other studies, not addressing the same specific
question about outcomes of HU treatment, often missed
some of the above information; the most frequent issue
was lack of stratification by HU treatment. For six of these
studies, original databases were readily available, allowing
us to fully extract data about HU treatment, outcomes and
potential confounders. We were unable to retrieve full
information from two additional reports4,29 but, in spite of
this, we were able to extract incidence of at least one of
the outcomes of interest. In eight studies, we were able to
univocally distinguish arterial and thrombotic events in 2,048 patients.7,19,23,26-28,31,33
Overall, demographics were incomplete or not stratified by HU treatment (6 studies), cardiovascular risk factors were missing (10 studies), and history of thrombosis was not reported (6 studies), antithrombotic drug therapy was not mentioned in ten studies. However, in spite of missing data, in each of these studies we were able to retrieve the number of events for at least one outcome.
Two studies referred to the same population4,17 but reported different outcomes; therefore, we did not consid- er it as a duplicate for the aims of our analysis.
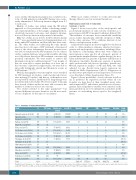
Table 1. Summary of study characteristics.
While most studies referred to events after first-line therapy, three focused on recurrent thromboses.
Hydroxyurea and risk of outcomes
Summary of events
Figure 2 shows forest plots of the study-specific and pooled yearly incidence of each outcome of interest as % person/years with 95% binomial Confidence Interval (CI). The incidence of outcomes shows remarkable variability across studies. In particular, with the exception of AML, for the other outcomes, 95% confidence intervals do not always overlap between studies.
A mixed effect logistic model was applied to the data in order to obtain incidence estimates adjusted for hetero- geneity and study-specific confounders, including follow- up duration. Confounding effects that were verified in meta-regression were age (for all outcomes), percent of patients under antiplatelet/anticoagulant therapy (for mor- tality and thrombosis), percent of patients with history of thrombosis (mortality, thrombosis), percent of patients with cardiovascular risk factors (mortality, thrombosis). Overall, regression analysis of MF and AML was only adjusted for age. Results from logistic regression are detailed in Online Supplementary Table S1. Diagnostics of model fit were performed by visual inspection of observed versus fitted plots (Online Supplementary Figure S1).
Figure 3 shows probability of each outcome in follow up as predicted by regression models when all con- founders are kept fixed at their weighted mean value, with estimated ICC and relative statistical tests of hetero- geneity. Since all predictor variables were centered on the mean, predictions are to be interpreted as incidence in the presence of confounding factors equal to the (weighted) mean.
Study
Alvarez-Larrán, et al.(2012) Alvarez-Larrán,
Kerguelen, et al.(2016) Barbui, et al.(2014) Bonicelli, et al.(2013) Crisa, et al.(2017)
N FUP years
261 7·2
890 4·6
137 7·7 114 11 35 6·3 34 5·1
Median age (range)
64 (16-88)
68 (18-95)
60.5 (23-83)
Sex (M/F)
118/143
452/438
69/68
23/12 10/24 24/21 46/58 60/67
22/24 108/76 34/22
296/312
Mortality MF AML
48 20 8
99 39 17
Thrombosis Bleeding
45 23
71 48
Study quality2
9/9
9/9
8/9 6/9 8/9 8/9 8/9 8/9 5/8 (1) 5/8 (1) 8/9
8/9
55 (36-65) 51.5 (19-80) DeStefano,etal.(2016b) 45 7 71.5(46-90)
3 21
7
2 3
1 105 1 7 1 2 18
0 2 2
72 1 196 1 163
16 12
3 3 3 2 3 6 16 2 0 0 0 0
3 6 6 3 1 0
173 118
De Stefano, et al. (2016a) De Stefano, et al.(2018)
Gisslinger, et al.(2016) Gisslinger, et al. (2017) Hintermair, et al. (2018) Lussana, et al.(2014) Marchioli, et al.(2013) Mesa, et al.(2017) Podoltsev, et al.(2018) Tefferi, et al.(2013)
Total
104 3·7 127 1
73 2·7 25 8 46 12·4
184 2·4 56 0·3 497 2·83 608 6·9
3,236 .
73 (43-95) 60 (21-81)
35.8 (22-40) 71 (44-87) 66 (19-85) 77
63.3 (19-95)
68.41
8/9
0 2 6/7(2)
151 64
522/3,097 157/2,600
18 130
63/2,714 469/2,552
8/9
8/9
88/1,485
1Weighted mean. 2Evaluation on 9 items according to JBI appraisal tool for prevalence studies. In parenthesis number of items for which evaluation was not applicable based on study design. MF: myelofibrosis; AML: acute myeloid leukemia; N:number; FIP: follow up; M: male; F: female; JBI: Joanna Brigg’s Institute.
2394
haematologica | 2019; 104(12)
