
Page 153 - 2019_12-Haematologica-web
P. 153
c-Abl/NIK limits the efficacy of Aurora inhibitors
we formulated the hypothesis that NIK, a kinase capable of activating both the alternative and classical NF-κB pathways through IKKa/β phosphorylation,2-4 could interfere with the inhibitory effects of pan-AKI on NF-κB signaling.24,25
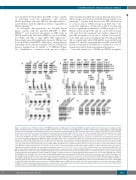
To investigate this hypothesis, we blocked Aurora kinase activity with the pan-AKI MK-0457 or PHA- 680632,25,29 and monitored the impact on NIK levels in HMCL with barely detectable (OPM-2), very low (U266), low (8226 and R5), or high (JJN3) NIK expression.2-4 Interestingly, pan-AKI significantly increased NIK protein levels in all the tested HMCL, although to varying degrees depending on the cell line examined, with an average fold increase ranging from 1.3 (U266) to 7.8 (OPM-2) (Figure 1A). Furthermore, consistent with previous studies
demonstrating that MM-microenvironmental interactions induce reciprocal activation of NF-κB in both cellular com- partments,35 together with the fact that NIK stabilization is a critical step for NF-κB activation in MM cells,2-4 we found that adherence of MM cells to HS-5 stromal cells caused a significant accumulation of NIK protein in 4 of 5 HMCL tested (except JJN3) and also in the HS-5 stromal cells, and that this increment was further enhanced by pan-AKI treatment in both the co-cultured cell popula- tions, MM and stromal cells (Figure 1B). Notably, pan-AKI did not significantly affect NIK mRNA levels in MM cells (Figure 1C), thereby suggesting that pan-AKI-induced NIK protein accumulation in MM cells is mainly due to post- translational rather than transcriptional regulation.
Given the critical role of TRAF2 and TRAF3 in regulat-
AB
C
DE
Figure. 1. Aurora kinases inhibition enhances NF-κB-inducing kinase (NIK) expression through TRAF2 degradation. (A) Western blot analysis of endogenous NIK, TRAF2 and TRAF3 proteins in multiple myeloma (MM) cell lines treated for 24 hours (h) with MK-0457 (0.4 μM) or PHA-680632 (1 μM); anti-Actin immunoblotting was performed as loading control. Bands were subjected to densitometric scanning using the TINA 2 software and the ratio of NIK to Actin, TRAF2 to Actin and TRAF3 to Actin was calculated. The relative fold change of protein levels was normalized with respect to the level of the untreated control, which was taken as 1, and is shown under each lane. Histogram represents the mean±Standard Deviation (SD) of six independent experiments (Tukey-Kramer test, °P<0.05, *P<0.005, **P<0.001). (B) MM cell lines were incubated with MK-0457 (0.4 μM) or PHA-680632 (1 μM) in presence or absence of human bone marrow-derived stromal cell line HS-5 (see Online Supplementary Methods). After 24 h, MM cell lines were separated from HS-5, lysed and subjected to western blot analysis to monitor the expression of NIK, TRAF2, TRAF3 and Actin as loading control. Bands were then subjected to densitometric analysis as described above and the relative fold change of protein levels was normalized with respect to the level of the untreated control in absence of HS-5, which was taken as 1, and is shown under each lane. In the same way, western blot and densitometry analysis of NIK, TRAF2 and TRAF3 were performed in HS-5 stromal cells separated from co-culture with OPM-2 and JJN3 cells. (Bottom) Changes (folds increase or decrease) in the levels of each protein relative to untreated control in absence of HS-5, which was taken as 1; the his- tograms represent the mean±SD of 3 independent experiments (Dunnett test, °P<0.05; *P<0.01; **P<0.005). (C) MM cell lines were incubated with MK-0457 (0.4 μM) or PHA-680632 (1 μM) and after 24 h RNA was purified and the expression levels of NIK and TRAF2 mRNA were determined by RT-qPCR in untreated (CTR), MK- and PHA-treated cells. The relative mRNA fold change in treated versus untreated cells was calculated by the 2^-ΔΔCT method. Results are expressed as mean±SD of two independent determinations. Relative mRNA fold changes comprised between 0.5 and 2 (indicated with black lines) are not considered biologically relevant. (D) RPMI-8226 and 8226/R5 cells were transfected with siRNA against Aurora A and Aurora B (AURK A+B) or unrelated non-specific control siRNA. Forty-eight hours after siRNA transfection MM cell lines were subjected to western blot analysis to monitor the expression of Aurora A, Aurora B, TRAF2, NIK and Actin as loading con- trol. TRAF2 and NIK bands were then subjected to densitometric scanning and the number below each lane represents the relative amount of TRAF2 and NIK nor- malized to Actin. Protein expression under control siRNA conditions was set as 1 for comparison. (E) MM cell lines were electroporated with non-specific control siRNA or with TRAF2 siRNA. After 24 h, lysates from control or TRAF2 siRNA-transfected MM cells were subjected to western blot analysis to monitor the expression of TRAF2 and NIK; anti-Actin immunoblotting was performed as loading control. The number below each lane represents changes (folds increase) in the levels of NIK in TRAF- 2 siRNA relative to control siRNA condition which was set as 1 for comparison.
haematologica | 2019; 104(12)
2467
