
Page 212 - 2019_11 Resto del Mondo-web
P. 212
P. Merli et al.
statistically significant already at day +3 after HSCT. In particular, mean IFNγ levels at day +3 were 8859±7502 pg/mL in GF patients versus 0 pg/mL in controls (P=0.03); CXCL9 levels were 1514.0±773 pg/ml versus 233.6±50.1 pg/mL (P=0.0006); IL10 levels were 58.8±39.1 pg/mL versus 1.7±1.1 pg/mL (P=0.01); TNFα levels were 3.5±1.0 pg/mL versus 0.9±0.2 pg/mL (P=0.02). In this cohort, receiver operating characteristics (ROC) analysis on CXCL9 levels at day +3 showed an area under the curve (AUC) of 0.905 [95% Confidence Interval (CI) 0.709- 0.987; P<0.0001] (Online Supplementary Figure S1); a cut-off value of 274.5 pg/mL had a sensitivity of 88.89% and a specificity of 78.57%. The ROC analysis of other markers, which were significantly increased at day +3 showed an AUC of 0.802 for TNFα (95%CI: 0.566-0.944; P=0.006), of 0.756 for IL10 (95%CI: 0.529-0.912; P=0.011) and of 0.682 for IFNγ (95%CI: 0.471-0.849; P=0.017).
Since primary HLH patients commonly present increased IFNγ and its related chemokines serum levels during disease reactivation/flare (that is frequent after fail- ure of HSCT19), we performed additional analyses exclud- ing this subset of patients in order to validate the data in disorders other than HLH. Even after excluding HLH patients, CXCL9 and IL10 serum levels remained signifi- cantly higher in patients experiencing GF in comparison with controls (Online Supplementary Figure S2).
Activation of macrophages and T lymphocytes characterizes graft failure in allogeneic hematopoietic stem cell transplantation
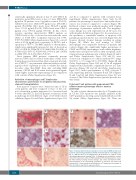
Bone marrow biopsies were obtained at time of GF in seven patients and were compared to those of five con- trols (obtained in a similar time period, i.e. between 2 and 3 weeks after HSCT). In all GF patients, evaluation of BM morphology showed different stages of GF with reduced cellularity (Figure 3A and Online Supplementary Figure S3A
and B) as compared to patients with sustained donor engraftment (Online Supplementary Figure S4A). In GF patients, the percentage of myelocytes and erythroid pre- cursors was reduced compared to controls (Figure 3B). Erythroid colonies were markedly smaller, with a higher percentage of premature erythroid cells. The megakary- ocytic lineage was well represented in all GF cases, but with irregular distribution (Figure 3C). In several areas of the specimens, a remarkable number of apoptotic cells partially grouped in clusters was observed (Figure 3D). All biopsies showed stromal damage resulting in edema (Figure 3E). While the total number of CD68+ macrophages was comparable between GF patients and controls (Figure 4A), significantly higher percentages of CD68+ and CD163+ macrophages, with cellular fragments, erythrocytes and lipid vacuoles in their cytoplasm, (indi- cating activation and phagocytic activity) (Figure 3F and G and Online Supplementary Figure S3C and D), were observed in comparison to controls [median 80% (range 30-100%) vs. 0% (range 0-5%); P<0.0001] (Figure 4B and Online Supplementary Figure S4B and C). In all analyzed samples from GF patients, a significant increase in T lym- phocytes (Figures 3H and 4A and Online Supplementary Figure S3G), with a predominance of CD8+ cytotoxic T cells, expressing perforin, Granzyme B and TIA-1 (Figures 3I and J and 4A and Online Supplementary Figure S5) was observed. The Online Supplementary Appendix provides fur- ther details.
Polyclonal T-cell pattern with predominant CD8 effector memory phenotype effector memory phenotype
In order to better characterize the role of T lymphocytes in GF, the TCR repertoire was initially analyzed in the CD3+ population, showing a polyclonal distribution of the Vβ chains (Online Supplementary Figure S6). Then, we
ABC
D
EFGH
IJ
Figure 3. Immunohistochemistry evaluation of bone marrow (BM) specimens in a patient experiencing graft failure (Pt #4). (A) Hematoxylin & eosin (H&E) stain- ing of a BM specimen at 4X magnification. (B) Evaluation of erythroid colony spreading by glycophorin staining (10X). (C) Megakaryocyte distribution evaluat- ed by CD61 expression (10X). (D) H&E staining at 40X showing apoptotic events. (E) H&E staining revealing stromal damage and edema development (40X). Characterization of the macrophage population by CD68 (F) and CD163 (G) staining (40X). Characterization and distribution of T lymphocytes by analysis of CD3 (H), CD4 (I), and CD8 (J) expression (10X).
2318
haematologica | 2019; 104(11)
