
Page 210 - 2019_11 Resto del Mondo-web
P. 210
P. Merli et al.
Results
Patients’ characteristics
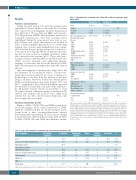
During the study period, 15 consecutive patients who experienced GF were eligible for the study. Most of them were affected by non-malignant disorders characterized by a high risk of GF (e.g. SAA and HLH) and received a TCD allograft from a PMFD. Fifteen children, matched for transplant characteristics, who had sustained donor engraftment during the same period were used as con- trols. Patients' and control characteristics are detailed in Table 1. Main transplant characteristics (i.e. conditioning regimen, type of donor, graft manipulation) were compa- rable between the two groups (except for a trend for a lower age in the GF group). Of the 15 patients experienc- ing GF, ten were tested for anti-HLA antibodies, which were detected in five patients (50%). Those who had a mean fluorescence intensity (MFI) of anti-HLA antibodies >5000 received rituximab and underwent plasma- exchange to lower the value below the threshold of 5000 MFI;18 this treatment successfully reduced the MFI value in all cases.
Signs and symptoms of patients who either did or did not experience GF are detailed in Table 2. The most fre- quent sign associated with GF was fever, occurring at a median time of six days from the infusion of the graft (range 1-16 days). Moreover, both lactate dehydrogenase (LDH) and ferritin increased in many patients (80% and 46.7%, respectively); these laboratory findings appeared late after HSCT (at a median of 11 and 10 days, respective- ly). All patients received steroids in an attempt to avoid GF, without benefit. Chimerism analysis performed on PB showed only recipient cells in all GF cases, while in all controls but one, who showed mixed chimerism, only donor-origin cells were found.
Table 1. Characteristics of patients who either did or did not experience graft failure (GF).
Total
Gender Female Male
Age at transplant, years (median and range) Disease
SAA
HLH
AML
ALL
Erythroid disorders§ CAMT
Metabolic disorders* Osteopetrosis
PID‡
Type of transplant TCD haploidentical MUD
UCBT
Source of stem cells PBSC
BM
Cord blood
Conditioning regimen TBI-based Busulfan-based
Treosulfan-based
Other regimens
Donor/recipient pair sex mismatch
Yes
No
GF patients (%)
15 (100)
9 (60)
6 (40)
2.6 (0.3-16.3)
4 (27) 3 (20) 1 (6.5) 1 (6.5) 1 (6.5) 1(6.5) 2 (13.5) 1 (6.5) 1 (6.5)
13 (87) 1 (6.5) 1(6.5)
13 (87) 1 (6.5) 1 (6.5)
0
8 (53) 3 (20) 4 (27)
4 (27)
11 (73)
Controls (%) P 15 (100)
0.27
10 (66.5)
5 (33.5)
8.1 (0.9-18) 0.1
4 (27) 0
2 (13.5) 3 (20) 4 (27) 0
1 (6.5) 0
1 (6.5)
10 (66.5) 5 (33.5) 0
11 (73) 4 (27) 0
2 (13.5) 10 (66.5) 2 (13.5) 1 (6.5)
9 (60)
6 (40)
0.38
0.13
0.22
0.23
0.14
Kinetics of IFNγ, CXCL9, IL10 and IL2Rα serum levels are shown in Figure 1A-D, while serum levels of TNFα, CXCL10, sCD163 and IL6 are shown in Figure 2A-D. Serum levels of these cytokines/chemokines differed between patients experiencing GF and controls, starting from the first days after the infusion of the graft. Notably, for IFNγ, CXCL9, IL10 and TNFα, this difference became
Cytokine/chemokine profile
SAA: severe aplastic anemia; HLH: hemophagocytic lymphohistiocytosis: AML: acute myeloid leukemia; ALL: acute lymphoblastic leukemia; CAMT: congenital amegakaryocytic thrombocy- topenia; PID: primary immunodeficiency; TCD: T-cell depleted; MUD: matched unrelated donor; UCBT: unrelated cord blood transplant; PBSC: peripheral blood stem cells; BM: bone marrow; TBI: total-body irradiation; MLD: metachromatic leukodystrophy; MPS: mucopolysac- charidosis; ALD: adrenoleukodistrophy; DBA: Diamond-Blackfan anemia; *1 case each of MLD and MPS-I in GF group; 1 case of ALD among controls; §1 case of Thalassemia in GF group; 2 cases of Thalassemia and 2 of DBA among controls; ‡1 case of combined immunodeficiency in GF group; 1 case of autosomal recessive hyper-IgE syndrome among controls. SAA: severe aplastic anemia.
Table 2. Signs and symptoms of patients who experienced graft failure (GF). Signs/symptoms GF patients Percentage
(total=15)
Fever 13 86.7
Increase of ferritin serum levels° 12 80.0 Hemophagocytosis^ 5^ 71.4^
Median day of onset
6
11
12 10 11 10
Range Controls Percentage P (total=15)
1-16 7 46.7 0.02
4-20 2 13.3
0§ 0 0.02
4-16 2 13.3 N.S. 8-17 1 6.7 0.03 8-13 0 0 0.04 10-19 2 13.3 N.S.
0.0007
Hypertriglyceridemia/
hypofibrinogenemia
Increase of LDH serum levels Splenomegaly
Skin rash
Other
Bradicardia
7 46.7 7 46.7 5 33.3 3 20.0
1 6.7 9 NA
0 0 N.S.
°LDH: lactate dehydrogenase; N.S.: not significant. ° >3000 ng/mL. ^ Seven patients out of 15 were evaluated. §Five patients out of 15 were evaluated.
2316
haematologica | 2019; 104(11)
