
Page 172 - 2019_11 Resto del Mondo-web
P. 172
M.C. Minnema et al.
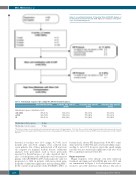
Figure 1. Consolidated Standards of Reporting Trials (CONSORT) diagram of the 50 patients included in the trial. HDM: high-dose melphalan; G-CSF: granu- locyte colony-stimulating factor.
Table 2. Hematologic response rates during the different treatment phases.
After induction therapy
+6 months after auto-SCT (n=35)
86% (60%) 72% (50%) 46% (32%)
+12 months after auto-SCT (n=34)
89% (60%) 77% (52%) 56% (38%)
+24 months after auto-SCT (n=33)
91% (60%) 76% (50%) 58% (38%)
Hematologic response (intention to treat)
≥PR (ORR) ≥VGPR
CR
Median time to first response
Median time to best response
83% (80%) 66% (58%) 23% (20%)
28 days
67 days
*The first percentage concerns patients who underwent autologous stem cell transplantation (35 in total),the second percentage between brackets is the response rate assessed in an intention-to-treat analysis.Auto-SCT: autologous stem cell transplantation; PR: partial response; ORR: overall response rate;VGPR: very good partial response; CR: complete response.
detected at baseline was 1.4% (range, 0.17-4.9). At 6 months after auto-SCT, samples were collected from seven patients. Six of these patients had a CR and were also negative for minimal residual disease. Additional analyses were performed, such as those previously reported by Perez-Persona et al. who described that a ratio of clonal plasma cells within the total bone marrow plasma cells (aPC/BMPC) ≥95% had prognostic value for progression to MM in patients with monoclonal gam- mopathy of unknown significance and smoldering MM.18 In the current study patients with aPC/BMPC ≥95% at
baseline had a shorter PFS (hazard ratio 8.44, 95% confi- dence interval: 1.05-67.96) and a lower probability of pro- ceeding to auto-SCT; however, given the small sample size this was not statistically significant (odds ratio 0.16, 95% confidence interval: 0.02-1.67).
Organ responses
Organ responses were already seen after induction treatment and improved after HDM plus auto-SCT and are summarized in Figure 3 for both patients who pro- ceeded to auto-SCT and those who did not. The rate of
2278
haematologica | 2019; 104(11)
