
Page 170 - 2019_11 Resto del Mondo-web
P. 170
M.C. Minnema et al.
each induction cycle, after stem cell mobilization and before auto- SCT, and thereafter every 3 months for 5 years after registration. In addition, patients could participate in a side study with meas- urement of minimal residual disease by flow cytometry when a CR was reached or 6 months after auto-SCT. Flow cytometry was performed centrally with a sensitivity level of 10-5. Details are pro- vided in the Online Supplement.
Statistical design and endpoints
The primary endpoint was the efficacy of bortezomib-dexam- ethasone induction treatment followed by HDM and auto-SCT,
measured as the proportion of patients with a CR at 6 months after auto-SCT. The secondary endpoints and analysis of the effect of baseline characteristics on auto-SCT, OS and PFS are described in the Online Supplement.
Results
Patients’ characteristics
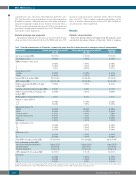
Between March 2012 and April 2016, 50 patients were enrolled in the phase II part of the trial. Table 1 summa-
Table 1. Baseline characteristics of 50 patients, separated for groups that did or did not proceed to autologous stem cell transplantation.
Characteristic
Age (years), median (IQR)
Sex (female), n (%)
WHO performance status, n (%) 0
1 2
Clonal disease, n (%) Lambda
Kappa
Involved FLC level, median (IQR) dFLC, median (IQR)
Patients who proceeded to auto-SCT Patients who did not proceed to auto SCT All patients (N=35) (N=15) (N=50)
Number of patients with dFLC ≥ 180 mg/L, median (IQR)
59 (50-63)
14 (40%)
17 (49%) 16 (46%) 1 (3%)
27 (77%)
8 (23%) 167 (63-341) 214 (103-342) 17 (49%)
6 (4-11) 12 (34%)
2 (1-3)
26 (74%) 12 (34%)
29 (83%) 23 (66%) 4 (11%) 4 (11%) 8 (23%) 5 (14%)
12 (34%) 10 (29%) 12 (34%)
22 (63%)
12 (34%) 675 (166-1638)
12 mm (11-15) 63% (55-71) 60% present
68 (58-87)
12 (34%) 19 (54%) 4 (11%)
60 (53-63)
6 (40%)
6 (40%) 5 (33%) 4 (27%)
13 (87%)
2 (13%) 205 (64-493) 212 (68-461) 8 (53%)
5 (2-8) 2 (13%)
2 (1-3)
10 (67%) 7 (47%)
12 (80%) 10 (67%) 3 (20%) 0 (0%) 5 (33%) 3 (20%)
4 (27%) 6 (40%) 5 (33%)
6 (40%)
9 (60%) 1110 (264-2292)
13 mm (12-14) 58% (53-66) 60% present
90 (60-95)
8 (53%) 6 (40%) 1 (7%)
59 (51-63)
20 (40%)
23 (46%) 21 (42%) 5 (10%)
40 (80%)
10 (20%) 181 (73-35) 213 (80-397) 25 (50%)
6 (0-33) 14 (28%)
2 (1-3)
36 (72%) 19 (38%)
41 (82%) 33 (66%) 7 (14%)
4 (8%) 13 (26%) 8 (16%)
16 (32%) 16 (32%) 17 (34%)
28 (56%)
21 (42%) 832 (204-1638)
13 mm (11-15) 60% (55-68) 60% present
72 (59-90)
20 (40%) 25 (50%) 5 (10%)
% plasma cells in bone marrow, median (IQR)
Number of patients with ≥ 10% plasma cells, median (IQR)
Median number of organs involved, n (%)
Number of organs involved ≥2
≥3
Organ involvement, n (%) Kidney
Heart
Nervous system Gastrointestinal system
Liver
Soft tissues
Mayo classification, n (%) I
II III
NYHA stage, n (%) I
II
NT-proBNP level (ng/L), median (IQR)
Echo cardiography, median (IQR) Mean left ventricular wall thickness Ejection fraction
Diastolic dysfunction
eGFR (mL/min/1.73 m2), median (IQR)
Renal stage I
II
III
Auto-SCT: autologous stem cell transplantation; WHO: World Health Organization; FLC: free light chain; dFLC: difference between involved and uninvolved free light chains; NYHA: New York Heart Association; NT-proBNP: N-terminal pro-brain natriuretic peptide; eGFR: estimated glomerular filtration rate.
2276
haematologica | 2019; 104(11)
