
Page 91 - 2019_10 resto del Mondo_web
P. 91
Tmem30a in erythropoiesis and EPOR signaling
Tmem30a deletion leads to PS exposure because of impaired PS translocation, it is difficult to determine whether the PS exposure is due to apoptotic or impaired PS translocation. Therefore, we employed the TdT-medi- ated dUTP nick end labeling (TUNEL) assay for determin- ing the intrinsic cellular apoptosis, thereby analyzing the apoptosis-related DNA fragmentation. TUNEL staining showed that the cKO fetal liver cells displayed significant- ly higher TUNEL positive cells compared with controls (Figure 3C and D). Taken together, these data indicate that the defect of erythropoiesis in the Tmem30a deficient fetal liver is at least partly due to increased apoptosis.
Tmem30a deficiency impairs phosphatidylserine flippase activity in erythroid cells
Tmem30a is the β-subunit of the P4-ATPase, which func- tions as a flippase to maintain phospholipid asymmetry. Previous study showed that loss of Tmem30a resulted in impaired PS translocation.22 Consistent with the previous study, our data showed that Tmem30a deficiency led to increased PS exposure in erythroid cells, as indicated by increased levels of Annexin V positive cells (Figure 4A and B). To examine if the increased PS exposure is at least part- ly due to impaired flippase activity, we analyzed the aminophospholipid flippase activity. NBD-PS fluorescence
ABC
D
E FGH
IJK
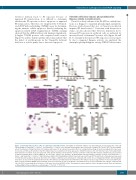
Figure 1. Tmem30a-deficient mice (cKO) are embryonic lethal with anemia. (A) Viability of Tmem30a embryos was determined. Scale bar represents 2 mm. (B) Timed matings of Tmem30aWT/flox; VavCreTg/+ and Tmem30aflox/flox; VavCre-/- were performed and embryos were harvested at stages E11.5 up to E16.5. The percentages reflect the numbers of living Tmem30a cKO embryos with respect to all embryos harvested in litters at each gestational stage. At least six pregnant mice have been checked at each time point and more than 35 embryos have been examined. (C) Gross appearance of E14.5 fetal livers. The cKO fetal livers were noticeably smaller than fetal livers of controls. Scale bar represents 2 mm. (D) The number of total fetal liver cells was counted in control and cKO embryos at E14.5. Data are presented as Mean ±Standard Error of Mean (SEM) for at least eight embryos per genotype. (E) Hematoxylin & Eosin staining of paraffin sections from Tmem30aflox/flox; VavCre-/- and Tmem30aflox/flox; VavCreTg/+ E14.5 fetal livers fixed in 4% formaldehyde solution. Scale bars represent 50 μm. (F) The red blood cell number was decreased in Tmem30a cKO peripheral blood. (G) Tmem30a cKO embryos exhibited reduced hematocrit compared with control mice at mid-gestation E14.5. (H) Hemoglobin levels were decreased in the peripheral blood in the cKO embryos. (I) Peripheral blood in Tmem30a cKO embryos reveals a large number of nucleated erythrocytes when sections underwent Wright-Giemsa staining. Scale bars represent 20 μm. (J) The BFU-E colony numbers were decreased in E14.5 cKO embryos compared with cKO. (K) CFU-E colony numbers per fetal liver of cKO were decreased at E14.5 in vitro. The graphs are representatives of three biological repeats. Data are indicated as Mean±SEM of three samples per each genotype. **P<0.01; ***P<0.001.
haematologica | 2019; 104(10)
1987
