
Page 161 - 2019_10 resto del Mondo_web
P. 161
Olaptesed pegol + BR in relapsed/refractory CLL
syndrome 3.6%). Grade 3/4 infections occurring during treatment were reported by single patients only (pneumo- nia 3.6%, cystitis 3.6%, infection 3.6%, lung infection 3.6%, chlamydial pneumonia 3.6% and sinusitis 3.6%) (Online Supplementary Figure S3). Of note, two (7.1%) patients experienced tumor lysis syndrome during the first treatment cycle, one laboratory (grade 1) and one clinical (grade 3) (Online Supplementary Figure S3).
Treatment response and survival
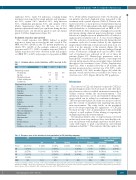
The overall response rate (ORR) defined as partial response or better, was assessed at the end of cycle 6. The ORR was 86% (24/28) in the ITT patient population, in which 75% (21/28) of the patients achieved a partial response and 10.7% (3/28) a complete response (Table 4). Similar response rates were observed in the full analysis set (ORR 89%; 24/27) and per-protocol population (ORR
Table 3. Common adverse events (incidence ≥10%) observed in the trial.
91%; 19/21) (Online Supplementary Table T3). Notably, all ten patients who had a high-risk status responded to the treatment with a partial response (Table 4). Patients who had received two or more previous treatment lines had an ORR of 82% (9/11) and patients who had been pre-treated with fludarabine or bendamustine had an ORR of 83% (19/23) (Table 4). After an increase of lymphocytosis in the pilot group during olaptesed pegol monotherapy, a rapid reduction of lymphocytosis in peripheral blood, with nor- malization by treatment cycle 2 – 3, was observed (Figure 3A). The reduction of circulating CLL cells during the first treatment cycles also became evident by the significant improvement of the CLL to leukocyte ratio from cycle 1 to cycle 4 in the majority of the patients (Figure 3B). At screening, 24 out of 28 patients reported enlarged lymph nodes. A reduction of lymph node size by ≥50% at the end of treatment was achieved in 18 out of these 24 patients (Figure 3C). Hematologic parameters such as hemoglobin concentration and platelet count improved after an initial expected drop; neutrophil values stabilized throughout the treatment course (Online Supplementary Figure S4). After a median follow-up of 28 months, the median progression-free survival was 15.4 (95% confi- dence interval: 12.2, 26.2) months (Figure 4A) while the median overall survival was not reached: the 3-year sur- vival rate was > 80% (Figure 4B) in the ITT population.
Discussion
The survival of CLL cells depends on periodic CXCL12- mediated migration into the bone marrow and other lym- phoid tissue in order to establish an interactive network of cellular contacts within the microenvironment.18 This interaction represents a novel and vulnerable therapeutic target which can be utilized in combination therapies.19 The here-presented phase IIa study was meant to investi- gate the concept of simultaneously targeting CLL and its microenvironment. The study builds on the preclinical proof-of-concept regarding the significance of CXCL12 blockade in CLL3,10 and on clinical phase I data in healthy subjects1 as well as phase II data relating to targeting the multiple myeloma microenvironment.11
The pharmacokinetic data of olaptesed pegol observed in this study were very similar to those from healthy sub- jects and patients with multiple myeloma studied previ- ously with regard to peak concentrations and terminal elimination half-life.1,11 This indicates that the uptake, dis-
Adverseevent
Grade1 Grade2 Grade3 Grade4
Hematologic toxicity
Neutropenia 10.7 32.1
Anemia 7.1 14.3 Thrombocytopenia 3.6 7.1 7.1 Febrile neutropenia 3.6 7.1 Leukopenia 10.7
Non-hematologic toxicity
Nausea 21.4 14.3 3.6 Constipation 17.9 3.6 3.6 Diarrhea 14.3 10.7 Vomiting 10.7 7.1 Abdominal pain upper 7.1 3.6 Pyrexia 17.9 14.3 3.6 Fatigue 10.7 3.6 Asthenia 14.3
Chills 10.7 3.6
General physical health 7.1 3.6
deterioration
Mucosal inflammation 10.7
Edema peripheral 7.1 3.6 Hypokalemia 14.3 7.1 Hyperuricemia 7.1 7.1 Cough 10.7 7.1
Pleural effusion 10.7
Rash 3.6 7.1
17.9
Cytokine release syndrome
10.7 3.6
Table 4. Response rates in the intention-to-treat population (n=28) including subgroups.
ITT
28 (100%)
3 (10.7%) 21 (75%) 3 (10.7%)
High risk# no
17 (61%)
3 (17.6%) 11 (64.7%) 2 (11.8%)
Prior treatment lines
Fludarabine OR bendamustine pre-treatment
*
N (%)
CR
PR
PD
yes
10 (36%)
0
10 (100%) 0
missing
1 (3.6%)
0
0
1 (100%)
1
17 (61%)
3 (17.6%) 12 (70.6%) 2 (11.8%)
2 or more
11 (39%)
0 (0%) 9 (81.8%) 1 (9.1%)
pre-treated
23 (82%)
1 (4.3%) 18 (78.3%) 3 (13%)
naïve
5 (18%)
2 (40%) 3 (60%) 0
NE 1(3.6%) 0 1(5.9%) 0 0 1(9.1%) 1(4.3%) 0
ORR 86% 100% 82% 0% 88% 82% 83% 100%
# defined as having a deletion of 17p13 or who relapsed within less than 24 months after previous fludarabine or bendamustine-containing treatment regimens according to Stilgenbauer&Zenz.13 *Responsepercentagesarecalculatedbasedonthenumberofpatientsintherespectivesubgroup.CR:completeremission;PR:partialresponse;PD:pro- gressive disease; NE: not evaluable; ORR: overall response rate (≥PR); ITT: intention-to-treat.
haematologica | 2019; 104(10)
2057
