
Page 159 - 2019_10 resto del Mondo_web
P. 159
Olaptesed pegol + BR in relapsed/refractory CLL
Results
Patients’ flow and characteristics
Thirty-two patients were screened. Ten patients were enrolled into the pilot group, which included a replace- ment for a patient withdrawn from the study after cycle 1. Eighteen more patients were enrolled after completion of the pilot group: these 18 patients started directly with combination treatment. Three patients discontinued ther- apy before completion of three treatment cycles because of chlamydial pneumonia, E. coli sepsis and one patient’s decision and five more patients discontinued therapy before completion of six treatment cycles because of rash, multiple episodes of infection, start of a new therapy after progressive disease and personal decision by two patients (Online Supplementary Figure S2). The median number of olaptesed pegol + BR cycles administered was six (range, 1-6). All 28 enrolled patients constitute the intent-to-treat (ITT) population and all analyses presented further below were performed on the ITT population. One patient with- drew his consent for the study before any disease assess- ment, thus the remaining 27 patients constitute the full analysis set.
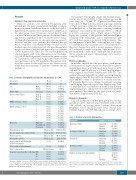
Table 1. Patients’ demographics and baseline characteristics (n = 28).
The patients’ demographic details and baseline charac- teristics are shown in Table 1. The median age was 66 years (range, 41 – 79) and 78% of patients had Binet stage B or C disease. High-risk CLL, defined as having a deletion of 17p13 or relapse within less than 24 months after pre- vious fludarabine- or bendamustine-containing treatment regimens,13 was found in ten patients (36%), of whom four (14%) presented with a 17p13 deletion (Table 2). Eighty-two percent of the patients had received prior treatment with fludarabine and/or bendamustine and 68% had been previously treated with rituximab. The median number of prior lines of therapy was one (range, 1-3) and the majority of patients (61%) had responded to their last therapy line with a partial response whereas 36% achieved a complete response. Eight patients (29%) presented with a deletion of 11q22-q23 and 13 patients (46%) a deletion of 13q14. Three patients (11%) had tri- somy 12 (Table 2).
Pharmacokinetics
In patients enrolled into the pilot phase, peak plasma concentrations of olaptesed pegol increased in an approx- imately dose-linear way with mean peak levels of 1.76, 3.95 and 7.20 μmol/L at doses of 1, 2 and 4 mg/kg, respec- tively (Figure 1 and Online Supplementary Table S1). The terminal elimination half-life in patients receiving 4 mg/kg olaptesed pegol was 53.2 h, total body clearance was 36.1 mL/h and the volume of distribution at steady state was 2.9 L; similar figures were obtained for patients receiving 1 and 2 mg/kg olaptesed pegol (Online Supplementary Table S1). Peak plasma concentrations at cycles 1 and 4, when olaptesed pegol was administered in combination with BR were similar to the values for the agent given as a single dose (Online Supplementary Table S2).
Pharmacodynamics
CLL cell mobilization in the pilot group was evident already 1 h after olaptesed pegol treatment with 10,196 CLL cells/μL on average above baseline detected in peripheral blood (mean baseline level: 41,318 CLL cells/μL). A peak of 22,939 CLL cells/μL on average above
Table 2. Detailed cytogenetic abnormalities.
Age (years)
BMI (kg/m2) Sex
Ethnic origin
Disease stage (Binet)
WHO Performance Status
CIRS Performance Score
Risk status
Hemoglobin (g / dL)
Absolute lymphocyte counts (x109/L)
Platelets (x109/L)
Neutrophils (x109/L)
Prior treatment with fludarabine and/or bendamustine
Prior treatment with rituximab
Prior treatment lines
Response to previous line of therapy
*Defined as having a deletion of 17p13 or who relapsed within less than 24 months after pre- vious fludarabine or bendamustine-containing treatment regimens according to Stilgenbauer & Zenz.13 BMI: body mass index; WHO: World Health Organization; CIRS: Cumulative Illness Rating Scale; SD: standard deviation.
Mean
Mean
N (%) N (%)
N (%)
N (%) N (%) N (%)
N (%)
N(%)
N (%) N(%) N(%) N (%) N(%) N(%) N(%)
N (%) N (%) N (%)
Male Female
Caucasian
Stage A Stage B Stage C
0
1
0 1 2 3 4 5 6
High risk* Non-high-risk Not known
66
25
16 (57%) 12 (43%)
28 (100%)
6 (21%) 11 (39%) 11 (39%)
23 (82%)
5(18%)
6 (21%) 3(11%) 4(14%) 1 (3.6%) 4(14%) 5(18%) 5(18%)
10 (36%) 17 (61%) 1 (3.6%)
12.432 (1.890) 47.309 (50.620) 145.89 (72.426) 4.249 (3.074) 23 (82%)
19 (68%)
1 (1-3)
Parameter
Deletion of 17p13
Deletion of 11q22-q23
Trisomy 12
Deletion of 13q14
Number of cytogenetic abnormalities
Number (%) of patients
Mean (± SD) Mean (± SD) Mean (± SD) Mean (± SD) N (%)
N (%) Median (range) N (%)
10 (36%)
Abnormal Normal Missing
Abnormal Normal Missing
Abnormal Normal Missing
Abnormal Normal Missing
0
1
2 Missing
4 (14%) 23 (82%) 1 (3.6%)
8 (29%) 19 (68%) 1 (3.6%)
3 (11%) 22 (79%) 3 (11%)
13 (46%) 14 (50%) 1 (3.6%)
6 (21%) 14 (50%) 7 (25%) 1 (3.6%)
CR
PR
PD N(%) - n.a. N (%) 1 (3.6%)
N (%)
17 (61%)
The fluorescence in situ hybridization panel analysis identified 21 (75%) patients with one or more cytogenetic abnormalities. IGHV status and TP53 mutations were not assessed.
haematologica | 2019; 104(10)
2055
