
Page 73 - 2019_09-HaematologicaMondo-web
P. 73
miR-127 controls HSC maintenance
tiation in cytospin preparation (Figure 5H). The propor- tion of cKit+ within dGFP+ cells was very high in both experimental groups at day 6. However, at day 9, it dropped significantly in cultures derived from sponged HSC, while this decrease was less dramatic in the EV group. Accordingly, cKit expression level was significantly
lower at day 9 in the 127DR group (Figure 5I). Finally, the expression of genes with myeloid expression pattern (Gene Expression Commons26) was higher in sponged cells from day 9 cultures compared to cells transduced with EV (Figure 5J).
Overall, these data suggest that a faster differentiation
ABCD
EFG
H
IJ
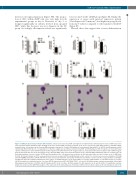
Figure 5. miR-127-3p prevents premature differentiation. (A) Cell cycle status of 127DR- and empty vector (EV)-transduced hematopoietic stem cell (HSC) was deter- mined by FACS analysis with Ki67/Sytox staining on the bone marrow (BM) of primary recipients (n= 4 and 5, respectively). (B-D) FACS analysis of 127DR- and EV- transduced Lin– cells isolated ex vivo from the BM of primary recipients (n= 5 and 6). (B) Analysis of early apoptosis (AnnexinV+PI–) in 127DR- and EV-transduced HSC identified by FACS within the Lin– cell population. (C) Reactive oxygen species (ROS) production in 127DR- and EV-transduced HSC in response to short (24 hours) cytokine stimulation in culture with StemSpan medium supplemented with SCF, TPO, Flt-3 Ligand and IL-3, measured by FACS after incubation with cellROX reagent. Vertical axis shows the ratio of the mean fluorescence intensity (MFI) at day (d) 1 versus mean fluorescence intensity (MFI) immediately after Lin– isolation (d0). (D) Early differentiation of ex vivo isolated 127DR and EV-transduced Lin– cells measured as reduction of cKit expression after one day of culture as in (C) (MFI ratio, d0/d1). (E) Colony forming cell (CFC) assay performed on ex vivo isolated 127DR- and EV-transduced Lin– cells (n=6). Colonies were scored as immature (CFU-GM and CFU-GEMM) and mature (CFU-M and CFU-G) at d9. Vertical axis shows the ratio between immature and mature colonies. (F) CFC assay performed on wild-type (wt) HSC two days after lentiviral transduction (d3 of culture, n=4 individual mice). (Left) Total number of colonies; (right) number of each different type of colonies. (G) FACS analysis for endothelial protein C receptor (EPCR) expression on GFP+cKit+CD48–CD150+ cells (n=4). (H) Representative cytospin preparations stained with May-Grunwald and Giemsa of 127DR- and EV-transduced HSC at d6 of culture. (I) FACS analysis for cKit expression at d6 and d9 (n=4). (J) Quantitative real-time polymerase chain reaction (qRT-PCR) analysis of the expression of the indicated genes in transduced HSC at d9 of culture relative to d9 non-transduced cells (n=3).
haematologica | 2019; 104(9)
1751
