
Page 169 - 2019_09-HaematologicaMondo-web
P. 169
CD20 and CD37 antibodies show synergy in CDC
ing the same Fc-Fc inhibiting mutation (K439E or S440K) strongly reduced CDC activity on Daudi and WIL2-S cells (Figure 5E and F). However, CDC of both cell lines was restored by mixing Hx-CD20-11B8 and Hx-CD37, each
carrying one of the complementary mutations K439E or S440K. These data suggest that Hx-CD20-11B8 and Hx- CD37 can indeed form hetero-hexameric complexes, thereby cooperating to activate complement.
A
BC
D
E
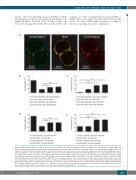
Figure 4. CD20 and CD37 mAbs colocalize on B cells. (A) Confocal fluorescence microscopy analysis to detect colocalization of cell-bound CD20 and CD37 mAbs. Raji cells were opsonized with hexamerization-enhanced A488-conjugated CD20 mAb 7D8-derived Hx-CD20-7D8 (image 1, green) and hexamerization-enhanced A594-con- jugated CD37 mAb 37.3-derived Hx-CD37 (image 2, red), and incubated for 15 minutes (min) at room temperature. Images were captured in PBS imaging medium at ambient temperature using a Zeiss Axi-oObserver LSM 700 microscope with Plan-Apochromat 63X/1.40 Oil DIC M27 objective lenses and acquired/processed using Zen software. Two excitation lasers were used at 488 and 555 nm. In the merged image, overlap of red and green produces orange or yellow. A representative example of two replicate experiments is shown. (B and C) FRET analysis to detect the molecular proximity of (B) WT type I CD20 mAb 7D8 (IgG1-CD20-7D8) or (C) WT type II CD20 mAb 11B8 (IgG1-CD20-11B8), WT CD37 mAb 37.3 (IgG1-CD37) or a combination thereof on the cell membrane of Daudi cells. (D and E) FRET analysis to detect the molecular proximity of hexamerization enhanced variants of (D) type I CD20 mAb 7D8-derived Hx-CD20-7D8 or (E) type II CD20 mAb 11B8-derived Hx-CD20-11B8, CD37 mAb 37.3-derived Hx-CD37 or a combination thereof on the cell membrane of Daudi cells. Daudi cells were opsonized with 10 μg/mL A555-conjugated- and 10 μg/mL A647-conjugated antibody variants for 15 min at 37˚C. FRET was calculated from mean fluorescence intensity values as determined by flow cytometry. Data shown are mean and Standard Deviation of six replicates collected from three independent experiments. ****P<0.0001.
haematologica | 2019; 104(9)
1847
