
Page 138 - 2019_09-HaematologicaMondo-web
P. 138
C. Rizzari et al.
Of note, the data on the relationship between serum asparaginase activity and CSF asparagine levels obtained in the two cohorts of patients were consistent within sub- groups defined by clinical and biological characteristics, such as sex, age, white blood cell count at diagnosis and immunophenotype (Table 4).
Table 5 shows asparagine levels in CSF according to
AB
whether the asparaginase activity in the serum was less than 100 IU/L or above this level at days +33 and +45 in (A) AIEOP and (B) BFM cohorts. The asparagine levels in CSF samples were significantly higher when serum asparaginase activity was below 100 IU/L than when it was higher than 100 IU/L in both cohorts (AIEOP and BFM).
Table 3. Asparagine levels in cerebrospinal fluid punctures scheduled on days +33 and +45 sorted according to respective serum asparaginase activity levels in the (A) Associazione Italiana di Ematologia e Oncologia Pediatrica (AIEOP) and (B) Berlin-Frankfurt-Münster (BFM) cohorts.
A
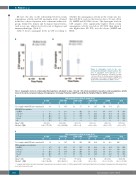
Figure 1. Asparagine levels in the cere- brospinal fluid during the induction phase. Box plots of asparagine levels (μmol/L) of cere- brospinal (CSF) punctures scheduled on days +33 and +45 in the (A) Associazione Italiana di Ematologia e Oncologia Pediatrica (AIEOP) and (B) Berlin-Frankfurt-Münster (BFM) cohorts.
PEG-asparaginase activity in serum (IU/L)
0 <100 ≥100 <500 ≥500 <1000 ≥1000 <1500 ≥1500 Total
N%N%N%N%N%N%
N. of samples with CSF and serum data 18
6.6
0.0 11.1 22.2 33.3 33.3
50 18.5
10 20.0 10 20.0 10 20.0 17 34.0 3 6.0
1.12 (1.4)
0.63 (0.28-1.44)
19 7.0
40 14.7
144 53.1 271
48 33.3 78 28.8 52 36.1 81 29.9 26 18.1 52 19.2 18 12.5 51 18.8
CSF ASN Concentration <LLOQ
>0.2 ≤0.5
>0.5 ≤1
0 2 4 6 6
8 42.1
7 36.8
3 15.8 9 1 5.3 9
12 30.0
>1 ≤4 >4
0 0.0 0.35 (0.5)
0.25 (0-0.4)
0 0.0 0.59 (0.6)
0.39 (0-0.89)
0 0.0 0.41 (0.5)
0.29 (0-0.65)
9 3.3 0.75 (1.3)
0.36 (0-0.87)
3.36 (3.1)
2.08 (0.57-6.35)
10
22.5 22.5 22.5
Mean* (SD)
Median* (IQR)
B
N. of samples with CSF and serum data 28
3 8
Mean* (SD) 1.50 (1.52) 0.67 (0.59)
Median* (IQR) 1.02 (0.56-2.12) 0.45 (0.22-1.10)
PEG-asparaginase activity in serum (IU/L) ≥100 <500 ≥500 <1000 ≥1000 <1500
≥1500
106 22.0 482
39 36.8 136 28.2 35 33.0 149 30.9 18 17.0 102 21.2 13 12.3 91 18.9
0 <100 N%N%N%N%N%N%
Total
CSF asparagina concentration
<LLOQ 3
10.7 10.7 28.6
21 23.3 27 30.0 15 16.7 27 30.0
5.8
90 18.7
116 24.1 142 29.4
31 26.7 42 29.6 38 32.8 46 32.4 28 24.1 33 23.2 18 15.5 21 14.8
>0.2 ≤0.5
>0.5 ≤1
>1≤4
>4 27.100.0
12 42.9
1 0.9 0.70 (2.03)
0.40 (0-0.83)
0 0.0 0.49 (0.48)
0.40 (0-0.80)
1 0.9 0.43 (0.59)
0.30 (0.01-0.65)
4 0.8 0.62 (1.17)
0.40 (0.01-0.88)
(*) samples with values below the lower limit of quantification are assigned a value of 0. PEG: pegylated; CSF: cerebrospinal fluid; LLOQ: lower limit of quantification; SD: standard devi- ation; IQR: interquartile range.
1816
haematologica | 2019; 104(9)
