
Page 137 - 2019_09-HaematologicaMondo-web
P. 137
Effects of PEG-asparaginase on CSF asparagine levels
only 28% of analyzed samples showed complete asparagine depletion (i.e. below the LLOQ) while relevant levels (≥1 μmol/L) were still detectable in around 23% of them. In particular, asparagine levels ≥1 μmol/L were detected at days +33 and +45 in 16.9% and 34.6% (AIEOP, Table 2A) and in 18.9% and 41.4% (BFM, Table 2B) of analyzed CSF samples, respectively. Median levels were significantly higher at day +45 than at day +33 (AIEOP, P<0.001; BFM, P<0.001).
Asparaginase activity in serum and correlation with cerebrospinal fluid asparagine levels
Overall there were 753 serum samples (AIEOP n=271 and BFM n=482) corresponding to the available CSF sam- ples of which 574 (AIEOP n=198 and BFM n=376) were collected on day +33 and 179 (AIEOP n=73 and BFM n=106) on day +45. The mean PEG-asparaginase activity levels measured in these serum samples were 1,839 (±685)
Table 1. Main biological and clinical characteristics at the onset of acute lymphoblastic leukemia in 736 patients enrolled in the AIEOP- BFM ALL 2009 protocol with at least one cerebrospinal fluid sample. Data are reported separately for the cohorts of patients belonging to the Associazione Italiana di Ematologia e Oncologia Pediatrica (AIEOP) and Berlin-Frankfurt-Münster (BFM) groups.
IU/L and 314 (±266) IU/L at days +33 and +45 in AIEOP samples (MAAT) and 1,226 (±470) IU/L and 222 (±141) IU/L in BFM samples (AHA test), respectively. PEG- asparaginase activity <100 IU/L was found in 1.9% of serum samples (2.5% in AIEOP and 1.6% in BFM) taken at day +33 and in 19.6% of serum samples (17.8% in AIEOP and 20.8% in BFM) taken at day +45 (Table 5A,B)
As shown in Table 3A (for the AIEOP cohort) and 3B (for the BFM cohort), at serum asparaginase activity levels <100 IU/L, 100% and 89.3% of the respective patients had CSF asparagine levels >0.2 μmol/L, while this rate decreased to approximately 70% at asparaginase activity ≥100 IU/L. Figures 2 and 3 (subdivided in A and B for the AIEOP and BFM cohorts, respectively) show the CSF asparagine levels at days +33 and +45 in relationship to the asparaginase activity detected at the same time points. At serum asparaginase activity levels lower than 100 IU/L the median CSF asparagine concentration was higher than that in the cohorts with serum activity above 100 IU/L and below 500 IU/L (P<0.003 for AIEOP and P<0.002 for BFM) and that with an overall activity level above 100 IU/L (P<0.001). When asparaginase activity and CSF asparagine levels were determined using progressively higher activity level intervals, even at high asparaginase serum levels of ≥1,500 IU/L, CSF asparagine levels below the LLOQ were found in roughly one-third of the samples (Table 3A and B), indicating that the asparagine level in the CSF was above the LLOQ even at higher levels of asparaginase activity in serum.
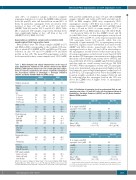
Table 2. Distribution of asparagine levels in cerebrospinal fluid, at each sampling point (days +33 and +45) in the (A) Associazione Italiana di Ematologia e Oncologia Pediatrica (AIEOP) and (B) Berlin-Frankfurt- Münster (BFM) cohorts.
Number of patients
Gender Male Female
Age
1-5 years 6-9 years 10-14 years 15-17 years
WBC (x 106/L) <20
245 100
149 60.8
96 39.2
145 59.2 40 16.3 43 17.6 17 6.9
164 66.9 60 24.5 21 8.6
491 100
291 59.3
200 40.7
272 55.4 96 19.6 78 15.9 45 9.2
315 64.2 112 22.8 64 13.0
A
AIEOP BFM N%N%
Day +33 N%N%
Day +45
N. of samples with CSF asparagine levels (μM) 230
20-100
84
20 23.8 18 21.4 17 20.2 24 28.6
56.0
1.12 (1.6)
0.58 (0.22-1.43)
Day +33 N%N%
456 133
<LLOQ
>0.2 ≤0.5
>0.5≤1 99 21.7 22 16.5 >1≤4 76 16.7 52 39.1
≥100
Final risk group
<LLOQ 77
>0.2≤0.5 74 32.2 >0.5≤1 40 17.4 >1≤4 33 14.3
TnonHR 18 7.3 45 9.2
33.5
6 2.6 0.61 (1.2)
0.30 (0-0.76)
BCP SR BCP MR HR
CNS status
CNS 1/2
CNS3 3 1.2 16 3.3
67 27.4 100 40.8 60 24.5
164 33.4 172 35.0 110 22.4
>4
Mean* (SD)
Median* (IQR)
B
N. of samples with CSF asparagine levels (μM)
234 95.5
426 86.8
Not known
Immunophenotype BCP
T
Not known
Genetics
TEL-AML positive MLL-AF-4 positive
CSF sample available At day +33 only
At day +45 only
At both days
8 3.3
214 87.3 31 12.7
41 16.7
1 0.4
161 65.7 15 6.1 69 28.2
49 10.0
414 84.5 76 15.5
1
96 19.6
2 0.4
358 72.9 35 7.1 98 20.0
Day +45
133 138
29.2 26 19.6 30.3 30 22.6
AIEOP: Associazione Italiana di Ematologia e Oncologia Pediatrica; BFM: Berlin- Frankfurt-Münster. WBC: white blood cells; HR: high risk; BCP: B-cell precursor; SR: standard risk; MR: medium risk; CNS: central nervous system; CSF: cerebrospinal fluid.
(*) samples with values below the lower limit of quantification are assigned a value of 0. CSF: cerebrospinal fluid; LLOQ: lower limit of quantification; SD: standard devia- tion; IQR: interquartile range.
>4
Mean* (SD)
Median* (IQR)
10 2.2 0.83(2.4)
0.4 (0-0.85)
3 2.3 0.9 (0.9)
0.75 (0.3-1.3)
haematologica | 2019; 104(9)
1815
