
Page 137 - 2019_08-Haematologica-web
P. 137
HLA class II is a good prognostic factor in ATLL
Overall survival of patients with adult T-cell leukemia/lymphoma according to HLA class II and programmed death ligand-1 expression
As we have previously reported, the nPD-L1+ group had significantly worse overall survival than the nPD-L1− group (median survival time, 5.93 months vs. 14.06 months, respectively; P=0.0119).10 Moreover, miPD-L1+ patients had a better prognosis than miPD-L1− patients (median survival time 15.63 months vs. 10.1 months, respectively) (P=0.0029).10
Patients in the HLA class II+/nPD-L1- group had a signif- icantly better survival time than the other patients. (P <0.0001) (Figure 4A). The HLA class II+/miPD-L1+ group had significantly better overall survival than the other groups (P<0.0001) (Figure 4B).
Clinico-pathological differences between HLA class II-positive and HLA class II-negative cases
The clinicopathological characteristics of HLA class II+ and HLA class II− cases are summarized in Table 3. HLA class II+ cases showed a significantly higher complete response rate (P=0.0421), higher HLA class I+/β2M+ expression (P=0.0165), and increased number of PD-1+ tumor-infiltrating lymphocytes (P=0.0020). Performance Status, International Prognostic Index, JCOG-PI, clinical stage, and therapies were not significantly different between the two groups. The association of HLA class II, PD-L1, and PD-1 expression is shown in Online Supplementary Figure S2. There was no significant associa- tion among them.
Prognostic factors in patients with adult T-cell leukemia/lymphoma
Table 4 presents results of univariate and multivariate analyses of prognostic factors in ATLL. In univariate analyses, age (>70 years) [hazard ratio (HR) 1.709; 95% confidence interval (95% CI): 1.106-2.608; P=0.0164], high JCOG-PI (HR 1.841; 95% CI: 1.186-2.819; P=0.0071), Ann Arbor stage III or IV (HR 1.801; 95% CI: 1.002-3.583; P=0.0491), HLA class II expression (HR 0.386; 95% CI: 0.233-0.617; P<0.0001), and HLA class II/miPD-L1 expres- sion (HR 0.276; 95% CI: 0.146-0.482; P<0.0001) were sig- nificantly related to prognosis.
In a multivariate analysis of HLA class II expression and other factors, HLA class II expression (HR 0.441; 95% CI: 0.263-0.714; P=0.0007) and high JCOG-PI (HR 1.841; 95% CI: 1.163-2.883; P=0.0096) showed significant prognostic value.
We also performed a random forest analysis including all available clinical prognostic factors (JCOG-PI, age >70 years, elevated lactate dehydrogenase, extranodal involve- ment, sex, elevated C-reactive protein, B-symptoms, clin- ical stage, chemotherapy, radiation, and transplantation) and HLA class II expression. JCOG-PI, HLA class II expres- sion, and age were associated with patients living for more than 2 years.
Discussion
In this report, we describe that HLA class II expression is an important prognostic factor in ATLL, as are both HLA class I/β2M and PD-L1 expression. HLA class II had a prognostic value in ATLL patients treated with standard chemotherapy in our study. Malignant melanoma,
Hodgkin lymphoma and lung cancer are often associated with PD-L1 expression on tumor cells and respond to immune checkpoint inhibitors. However, HLA class II was not associated with prognosis in patients with these can- cers treated with standard chemotherapy.23-25 In our study ATLL cases co-expressing PD-L1 and HLA class II, had a very poor prognosis, although the number of patients ana- lyzed was small (n=5, 3.8%). In the cases of Hodgkin lym- phoma and malignant melanoma, HLA class II expression predicted the clinical outcome of PD-1 blockade therapy, suggesting that the prediction of prognosis by HLA class II expression depends on the expression of PD-L1.24,26
HLA class I/β2M is also a good prognostic marker in ATLL patients. However, HLA class I+/β2M+ patients with- out HLA class II expression had a poor prognosis in this
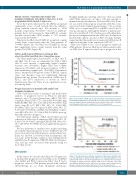
Figure 2. Association of HLA class II expression with overall survival in adult T- cell leukemia/lymphoma. The Kaplan–Meier plot depicts the survival difference between human leukocyte antigen (HLA) class II-positive (HLA class II+) and HLA class II-negative (HLA class II−) patients (P<0.0001; log-rank test).
Figure 3. Overall survival according to expression of HLA class II and HLA class I/β2 microglobulin in patients with adult T-cell leukemia/lymphoma. The patients with adult T-cell leukemia/lymphoma were stratified into four groups according to human leukocyte antigen (HLA) class II and HLA class I/β2 microglobulin (β2M) expression. Differences in overall survival among the four groups are shown in the Kaplan–Meier plot (P=0.0013; log-rank test).
haematologica | 2019; 104(8)
1629
