
Page 136 - 2019_08-Haematologica-web
P. 136
M. Takeuchi et al.
ABC
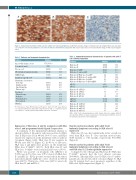
Figure 1. Immunohistochemistry of HLA class II in adult T-cell leukemia/lymphoma. (A, B) Representative images of human leukocyte antigen (HLA) class II-positive cases. Adult T-cell leukemia/lymphoma cells show membranes with/without cytoplasmic HLA class II expression. (C) A representative image of HLA class II-negative cases.
Table 1. Patients and treatment characteristics.
Table 2. Immunohistochemical characteristics of patients wth adult T- cell leukemia/lymphoma.
Features
Age, median (range), years
Sex (male/female)
PS score 2-4
IPI risk high or high-intermediate
JCOG-PI high
Ann Arbor stage III or IV
Shimoyama classification Acute type
Lymphoma type Smoldering type Chronic type
Treatment
Chemotherapy
Radiation 14/129 10.9
Numbers %
Features
Number %
44/132 33.3 88/132 66.7
48/120 40.0
72/120 60.0
22 18.3 17 14.2 26 21.7 55 45.8
9/130 6.9
121/130 93.1
5 3.8 39 30.0 4 3.1 82 63.1
83/132 62.9
49/132 37.1
32 24.3 12 9.1 51 38.6 37 28.0
67.5 (35-90)
75/57 43/129 78/126 50/129
HLA class II+ HLA class II-
33.3 61.9 38.8
HLA class Im+β2Mm+
HLA class Im- and/or β2Mm-
HLA class II+/HLA class Im+β2Mm+
HLA class II+/HLA class Im-and/or β2Mm-
111/132 84.1
53/108 49.1 52/108 48.1 3/108 2.8
- m m+ HLA class II /HLA class I +β2M
0/108
0.0
nPD-L1+
nPD-L1-
HLA class II+ nPD-L1+ HLA class II+ nPD-L1- HLA class II- nPD-L1+ HLA class II- nPD-L1-
miPD-L1+
miPD-L1-
HLA class II+ miPD-L1+ HLA class II+ miPD-L1- HLA class II- miPD-L1+ HLA class II- miPD-L1-
HLA class II /HLA class
I -and/or β2M
- m m-
115/131 87.8
Transplantation 17/129
No treatment 12/130
CR/CR(u) 32/115
13.2
9.2
27.8
PS,: Performance Status; IPI: International Prognostic Index; JCOG-PI, Japan Clinical Oncology Group-Prognostic Index, CR: complete response; CR(u),: complete response (unconfirmed). Only the patients with available data were calculated.
Expression of HLA class II and its comparison with HLA class I and programmed death ligand-1 expression
A summary of the immunohistochemical analysis is
shown in Table 2. Neoplastic cells were positive for HLA
class II (HLA class II+) in 44/132 (33.3%) cases, and HLA
class II was expressed on the membrane with or without
cytoplasm (Figure 1A,B). HLA class II was negative in
ATLL,: Adult T-cell leukemia/lymphoma; HLA: human leukocyte antigen; β2M: β2 microglobulin; nPD-L1: neoplastic programmed cell death ligand-1; miPD-L1: microen- vironmental programmed cell death ligand-1.
88/132 cases (66.7%) (Figure 1C). In 48 out of 120 cases,
Overall survival in patients with adult T-cell leukemia/lymphoma according to HLA class II expression
HLA class II+ cases had significantly better overall sur- vival than HLA class II− cases (median survival time, 36.53 months vs. 9.43 months, respectively; P<0.0001) (Figure 2).
Overall survival in patients with adult T-cell leukemia/lymphoma according to HLA class II and HLA class I/β2-microglobulin expression
Compared to the other groups, HLA class II+ /HLA class Im+/β2Mm+ patients had the best clinical outcomes (P=0.0013), although HLA class II+/HLA class Im+/β2Mm+ patients also showed favorable outcomes (Figure 3). HLA class II− patients had a poor prognosis regardless of the HLA class I/β2M expression (Figure 3).
HLA class I and β2M were positive on the membrane m+ m+ +
(HLA class I /β2M ) (40.0%). Both HLA class II and m+ m+
HLA class I /β2M were found in 22/120 cases (18.3%). PD-L1 was positive on neoplastic cells (nPD-L1+) in 9/130 cases (6.9%). Five cases (3.8%) were both HLA class II+ and nPD-L1+. PD-L1-positive stromal cells in the tumor microenvironment (miPD-L1+) were observed in 83/132 cases (62.9%). Thirty-two of 132 cases (24.3%) were both
HLA class II+ and miPD-L1+.
1628
haematologica | 2019; 104(8)
