
Page 130 - 2019_08-Haematologica-web
P. 130
J. Bond et al.
corticosteroid sensitivity, early chemosensitivity, and DNMT3A genotype, only DNMT3A genotype was associ- ated with cumulative incidence of relapse in univariate analysis (data not shown). As shown in Tables 2 and 3, age, log(WBC), corticosteroid resistance along with DNMT3A genotype were significantly associated with a poor event- free survival and overall survival. In multivariate analysis adjusting for these covariates, DNMT3A mutation was still significantly associated with shorter event-free sur- vival (HR 2.33, 95% CI: 1.06–4.04, P=0.02) (Table 2), although not with overall survival (HR 1.66, 95% CI: 0.82–3.37, P=0.16) (Table 3).
Taken together, these results provide strong evidence that DNMT3A mutation, while mostly observed in older cases, predicts a poor prognosis that is not related to the patient’s age.
Discussion
To our knowledge, this is the most extensive study of DNMT3A-mutated T-ALL yet reported. Our targeted NGS approach allowed comprehensive assessment of genotype across the entire DNMT3A locus, along with the prevalence of co-occurring genetic alterations. Our data additionally benefit from the analysis of a large cohort of patients who were uniformly treated as part of the GRAALL-2003 and - 2005 studies, thereby allowing rigorous outcome compar- isons between mutated and wild-type cases.
Some of our results were expected, and the findings that
DNMT3A mutations are more commonly present in older patients and genotypically immature leukemias are con- sistent with previously published data.9,11-13 We did not, however, observe increased rates of ETP-ALL immunophenotype, as might have been predicted. We did not detect a clear association with any other genetically- defined subgroup, and there was no link to increased HOXA expression, which we have previously shown to predict outcome in immature T-ALL.35
The detection of DNMT3A alterations in non-leukemic bone marrow suggests that some of these cases of T-ALL might have arisen from DNMT3A-mutated clonal hematopoiesis. While pre-leukemic NOTCH1 mutations have been detected in neonatal blood spot samples of pediatric patients with T-ALL,36 to our knowledge our data provide the first potential evidence of age-related clonal hematopoiesis in T-ALL. As it was not possible to obtain non-hematopoietic tissue from either of the patients with this finding, we cannot definitively exclude that these alterations are constitutional, or might even represent an inherited cancer predisposition. Further work is necessary to investigate the incidence of clonal hematopoiesis linked to alterations in DNMT3A and other genes in T-ALL.
Non-leukemic DNMT3A mutations have been seen in AML,30,31 and it has been postulated that DNMT3A-altered immature T-ALL might arise from malignant transforma- tion of a multipotent myeloid/lymphoid progenitor cell.12 In keeping with this, one of the cases with a non-leukemic DNMT3A mutation in this study had expression of myeloid cell surface markers as part of an ETP-ALL phe-
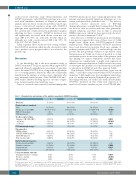
Table 1. Characteristics and outcome of the patients according to DNMT3A genotype.
Total (%)
Clinical subsets analyzed
Male
Median age (years)[IQR] WBC (109/L, median) CNS involvement
T-cell receptor status
Immature (IM0, IMD, IMG#) αβ lineage
γδ lineage
ETP immunophenotype#
Oncogenetics
HOXA positivity#
NOTCH1/ FBXW7 mutated RAS/ PTEN mutated
Risk classifier, high#
Early treatment response
Corticosteroid sensitivity Complete remission Induction death Induction failure
5-year treatment outcome
Cumulative incidence of relapse Event-free survival
Overall survival
DNMT3A Mutated 18 (9.1%)
13 (72.2%) 43.9 [40.7–53.6] 41.1
3 (16.7%)
8 (53.3%) 3 (20.0%) 4 (26.7%)
5 (35.7%)
4 (25.0%) 15 (83.3%) 5 (29.4%) 8 (44.4%)
6 (33.3%) 13 (72.2%) 3 (16.7%) 2/15 (13.3%)
53.9% 27.8% 38.8%
DNMT3A Wild-type 180 (90.9%)
128 (71.1%) 29.4 [23.2–37.2] 31.9
21 (11.7%)
38 (24.4%) 104 (66.7%) 14 (9.0%)
32 (20.3%)
41 (26.6%) 124 (68.9%) 33 (19.4%) 74 (42.3%)
102 (56.7%) 170 (94.4%) 5 (2.8%) 5/175 (2.9%)
28.7% 61.0% 68.7%
Total
198 (100%)
141 (71.2%) 30.5[23.4-40.4] 32.6
24 (12.1%)
46 (26.9%) 107 (62.6%) 18 (10.5%)
37 (18.7%)
45 (26.5%) 139 (70.2%) 38 (20.3%) 82 (42.5%)
108 (54.5%) 183 (92.4%) 8 (4.0%) 7/190 (3.7%)
30.5% 58% 66%
P-value
0.921
<0.001
0.491
0.463
0.015 <0.001 0.033
0.184
1.000 0.282 0.365 1.000
0.081
0.006 0.027 0.097
0.037 <0.001 0.001
#T-cell receptor status (n=171), early thymic precursor (ETP) immunophenotype (n=172), HOXA positivity (n=170) and Risk classifier based on NOTCH1, FBXW7, PTEN, NRAS and KRAS genotypes (n=193) were determined as previously described.32,33,35,37 For the Risk classifier, numbers categorized as high risk (NOTCH1/FBXW7 WT and/or NRAS/KRAS/PTEN altered) are shown. Statistically significant results are shown in bold.
1622
haematologica | 2019; 104(8)
