
Page 83 - 2019_07 resto del Mondo-web
P. 83
Post-lenalidomide immunomodulation in del(5q) MDS
the pre- and post-therapeutic samples. However, when GLIPH analysis was used to determine the dynamics of T- cell clusters with presumably identical antigen recogni- tion, we found that the majority of preexisting MDS-spe- cific BM T-cell clusters were either lost or reduced in size,
while new T-cell clusters with low to medium generation probabilities, which were shared between different patients, emerged upon lenalidomide treatment. Therefore, the cluster analysis provided indirect, but strong evidence that the observed T-cell dynamics is not
AB
CD
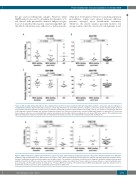
Figure 3. IGH clonality and hypermutation in the peripheral blood and bone marrow of patients with myelodysplastic syndromes at baseline and after initiation of lenalidomide treatment. (A,B) Clonality index and (C,D) somatic hypermutation rate of the IGH repertoire in samples of (A,C) bone marrow and (B,D) peripheral blood from patients with myelodysplastic syndromes before and after lenalidomide treatment and in samples from healthy controls. The median of each group is indicated in the diagrams. Statistical analysis was performed using the Student t-test. Differences between pre- and post-lenalidomide samples are indicated as P values and those between either pre- or post-lenalidomide samples and samples from healthy controls are indicated as +P values. BM: bone marrow; PB: peripheral blood; MDS; myelodysplastic syndrome; baseline: prior to lenalidomide treatment; post lena: after lenalidomide treatment; HD: healthy donor.
AB
Figure 4. TRB clonality in the peripheral blood and bone marrow of patients with del(5q) myelodysplastic syndromes at baseline and after initiation of lenalidomide treatment. (A,B) Clonality index of the TRB repertoire in samples of bone marrow (A) and peripheral blood (B) from patients with myelodysplastic syndromes before and after lenalidomide treatment and in samples from healthy controls. The median of each group is indicated in the diagrams. Statistical analysis was performed using the Student t-test. Differences between pre- and post-lenalidomide samples are indicated as P values and those between either pre- or post-lenalidomide sam- ples and samples from healthy controls are indicated as +P values. BM: bone marrow; PB: peripheral blood; MDS; myelodysplastic syndrome; baseline: prior to lenalidomide treatment; post lena: after lenalidomide treatment; HD: healthy donor.
haematologica | 2019; 104(7)
1361
