
Page 175 - 2019_07 resto del Mondo-web
P. 175
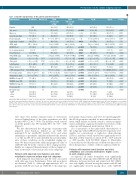
Performance of AL cardiac staging systems
Table 1. Baseline characteristics of the patients and their treatment.
Characteristic
Number
All patients
1224
Missing (%)
EGFR ≥50 mL/min 1.73m2
809 (66.1)
EGFR <50 mL/min 1.73m2
415 (33.9)
P-value
No AF
1037 (85.0)
Any AF
183 (15.0)
P-value
<0.001 0.003 0.033 0.008 0.731 0.012 0.003 0.003 <0.001 <0.001 <0.001 <0.001 <0.001 0.006 <0.001 <0.001 0.001 <0.001 <0.001 <0.001 0.416 <0.001
Age, years
Male sex
Intact heavy chain
Heavy chain, g/L
Light chain = lambda
dFLC, mg/L
ECOG PS ≤1
N.oforgansinvolved 3[1,7] 0 2[1,7] 3[1,7] 0.004 2[1,7] 3[1,7]
0
0 0.2 4.9 0 0 9.9
916 (74.8) 0 3211 [20, 565442] 0
0.03 [0.01, 0.95] 75.7* 0.07 [0.00, 2.97] 57.2* 47 [3, 3245] 27*
749 (61.2) 0 62.5 [ESRD, 262.4] 0
1.85 [0.01, 28.00] 12.3 1106 [1, 17160] 19.7 570 (46.6) 0
288 (23.5) 0 367 (30.0) 0 144 (13.4) 12.3
3.5 161 (13.6)
892 (75.5)
128 (10.8)
63 [30, 86] 738 (60.3) 550 (45.0) 10.6 [0.2, 1810.0] 946 (77.3)
62 [30, 85] 503 (62.2) 352 (43.6) 10.0 [0.5, 1810.0] 642 (79.4)
67 [39, 86] 235 (56.6) 198 (47.8) 12.3 [0.2, 51.2] 304 (73.3) 242 [0, 19808] 217 (59.0)
<0.001 0.069 0.181 0.11 0.019 0.08 <0.001
62 [30, 86] 605 (58.3) 451 (43.6) 10.3 [0.2, 1810.0] 803 (77.4)
68 [39, 83] 129 (70.5) 96 (52.5) 13.3 [0.8, 59.0] 139 (76.0) 248 [0, 12078] 102 (64.2)
215 [0, 19808] 817 (74.1)
198 [0, 19252] 599 (81.5)
589 (72.8) 2072 [20, 53794] 0.01 [0.01, 0.50] 0.06 [0.00, 2.10] 39 [3, 3245] 427 (52.8) 77.7 [50.0, 262.4] 1.04 [0.01, 18.27] 436 [1, 14551] 307 (37.9) 105 (13.0) 183 (22.6)
0 (0.0)
139 (17.8) 590 (75.4) 54 (6.9)
199 [0.00, 19808] 712 (75.6)
Heart involved NT-proBNP, ng/L cTnT, μg/L
cTnI, μg/L
hsTnT, pg/mL
Kidney involved eGFR, mL/min/1.73 m2 Proteinuria, g/day Albuminuria, mg/d MAYO2004 stage III MAYO3b stage IIIb MAYO2012 stage IV Renal stage III Chemotherapy
ASCT other none
327 (78.8) 8031 [40, 565442] 0.07 [0.01, 0.95] 0.10 [0.02, 2.97] 75 [6, 1350] 322 (77.6) 32.0 [ESRD, 49.9] 3.79 [0.03, 28.00] 2386 [1, 17160] 263 (63.4) 183 (44.1) 184 (44.3) 144 (40.8)
22 (5.5) 302 (75.9) 74 (18.6)
0.027 <0.001 <0.001 <0.001 <0.001 <0.001 <0.001 <0.001 <0.001 <0.001 <0.001 <0.001 <0.001 <0.001
743 (71.6) 2652 [20, 565442] 0.02 [0.01, 0.95] 0.06 [0.00, 2.97] 43 [3, 1350] 652 (62.9) 65.4 [ESRD, 262.4] 2.18 [0.01, 28.00] 1490 [1, 17160] 445 (42.9)
216 (20.8)
283 (27.3)
127 (13.8)
156 (15.6) 750 (74.9) 95 (9.5)
170 (92.9) 7010 [202, 216187] 0.07 [0.01, 0.67] 0.12 [0.04, 0.87] 71 [6, 3245]
95 (51.9)
55.0 [ESRD, 218.83] 0.69 [0.03, 16.99] 243 [1, 13618] 123 (67.2)
71 (38.8)
82 (44.8)
17 (11.0)
5 (2.8) 138 (78.4) 33 (18.8)
Categorical data are shown as counts (% of respective total), continuous data are shown as medians [range]. Statistically significant differences are represented in bold, italics. Bone marrow plas- macytosis was preferentially evaluated by cytology. *At least one troponin value was available for each patient. eGFR: estimated glomerular filtration rate; AF: atrial arrhythmia or pacemaker rhythm; dFLC: difference between involved and uninvolved free light chains; ECOG PS: Eastern Cooperative Oncology Group Performance Status; NT-proBNP: N-terminal pro-B-type natriuretic pep- tide; cTnT: cardiac troponin T; cTnI: cardiac troponin I; hsTnT: high-sensitivity cardiac troponin T; ASCT: high-dose chemotherapy followed by autologous stem cell transplantation; ESRD: end-stage renal disease.
were male. The median estimated time of observation (reverse Kaplan-Meier) of the study population was 45.5 months (95% CI: 41.7 - 50.8). The median overall survival of all the patients was 38.3 months (95% CI: 31.9 - 44.5) (Figure 1).
We first characterized the subgroups of patients with impaired renal function, defined as an eGFR <50 mL/min/1.73 m2 (eGFR<50) (n=415, 34%) and atrial arrhythmia or pacemaker stimulation (henceforth, referred to as AF) (n=183, 15%) and identified the potential influ- ence of these conditions on the established staging sys- tems. We then evaluated the additional prognostic value of eGFR<50 and AF in the context of these staging systems. Finally, we compared the performance of these staging sys- tems in the entire cohort and in each of the subgroups.
Patients with impaired renal function and atrial arrhythmias represent unique high-risk subgroups
Both impaired renal function and AF were associated with older age, lower Performance Status and more heart involvement (Table 1). Although approximately 40% of patients with AF also had an eGFR<50, both subgroups
had unique characteristics and were not interchangeable: the AF subgroup was enriched for men with heart involve- ment, while female sex (with a trend to statistical signifi- cance) and kidney organ involvement were features of the subgroup with impaired renal function (Table 1).
As a consequence of the unfavorable characteristics of the subgroups with eGFR<50 and AF, fewer patients were eligible for conventional or high-dose chemotherapy (Table 1) and their overall survival was significantly worse than that of their respective controls (17.5 vs. 52.9 and 12.6 vs. 45.5, months, both P<0.0001) (Figure 1). Univariable Cox models showed that the risk of death was almost dou- ble in the presence of either of these conditions (Table 2).
Patients with impaired renal function and atrial arrhythmias are correctly attributed to higher scores in each staging system
As expected, all cardiac biomarkers were significantly elevated in the subgroups with eGFR<50 and AF, while the difference between involved and uninvolved FLC (dFLC) was only slightly elevated among the patients with AF and not significantly elevated among those with eGFR<50
haematologica | 2019; 104(7)
1453
