
Page 122 - 2019_07 resto del Mondo-web
P. 122
M. Zaliova et al.
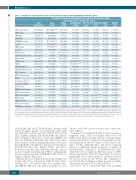
Table 2. Frequency of selected genetic lesions in total cohort and across acute lymphoblastic leukemia subsets.
Percentage of (number of total analyzed) cases positive for genetic lesions within total B-other cohort / individual ALL subsets
Total (n=103-110†)
53% (55/104)
11% (12/109) 5% (5/109) 5% (5/109) 51% (53/103) 9% (9/103) 8% (8/103) 4% (4/103) 18% (19/108) 12% (12/103) 6% (6/103) 24% (26/109) 15% (16/109) 9% (10/108) 21% (23/109) 26% (27/103) 28% (29/103) 14% (14/103) 8% (8/103) 4% (4/110) 6% (6/103) 8% (9/109) 6% (6/109) 17% (17/103) 13% (13/103) 5% (5/103) 8% (8/103)
7% (7/103)
B-rest (n=47)
82% (36/44)****
26% (12/47)**** 11% (5/47)* 11% (5/47)* 72% (31/43)*** 19% (8/43)** 19% (8/43)*** 9% (4/43)* 0% (0/46)
5% (2/43)
2% (1/43) 28% (13/47) 6% (3/47) 21% (10/47)*** 15% (7/47) 12% (5/43) 16% (7/43) 4% (4/43) 7% (3/43) 2% (1/47) 2% (1/43) 2% (1/47) 6% (3/47) 16% (7/43) 14% (6/43) 5% (2/43) 7% (3/43)
2% (1/43)
DUX4r (n=30)
21% (6/28)
0% (0/30) 0% (0/30) 0% (0/30) 32% (9/28) 0% (0/28) 0% (0/28) 0% (0/28) 63% (19/30)**** 24% (7/29)*
18% (5/28)** 0% (0/30) 0% (0/30) 0% (0/29) 0% (0/30) 21% (6/28) 21% (6/28) 0% (0/28) 4% (1/28) 0% (0/30) 0% (0/28) 17% (5/30) 0% (0/30) 4% (1/28) 0% (0/28) 0% (0/28) 4% (1/28)
0% (0/28)
BCR-ABL1-like (n=16)
50% (8/16)
0% (0/16) 0% (0/16) 0% (0/16) 50% (8/16) 6% (1/16) 0% (0/16) 0% (0/16) 0% (0/16) 6% (1/16) 0% (0/16) 69% (11/16)**** 69% (11/16)**** 0% (0/15)
75% (12/16)**** 69% (11/16)**** 69% (11/16)*** 50% (8/16)*** 25% (4/16)* 19% (3/16)** 25% (4/16)** 0% (0/16) 6% (1/16) 19% (3/16) 6% (1/16) 6% (1/16) 6% (1/16) 19% (3/16)
ZNF384r ETV6-RUNX1-like iAMP21
MEF2Dr (n=2)
50% (1/2)
0% (0/2)
0% (0/2)
0% (0/2)
50% (1/2)
0% (0/2)
0% (0/2)
0% (0/2)
0% (0/2)
50% (1/2)
0% (0/2)
0% (0/2)
0% (0/2)
0% (0/2)
0% (0/2)
0% (0/2)
0% (0/2)
0% (0/2)
0% (0/2)
0% (0/2)
0% (0/2)
0% (0/2)
0% (0/2)
50% (1/2)
50% (1/2)
0% (0/2)
0% (0/2)
0% (0/2)
PAX5 any aberration PAX5 fusion1
PAX5 AMP
PAX5 P80R CDKN2A/B deletion dic(9;20)
TOX deletion
trisomy 5
ERG deletion2
TBL1XR1 any aberration DMD deletion
CRLF2 fusion3
CRLF2r P2RY8-CRLF2-low JAK-STAT pathway lesion IKZF1 deletion
IKZF1 any aberration IKZF1plus
trisomy 21 acquired trisomy 21 germline EBF1 deletion
KMT2D any aberration SETD2 any aberration ETV6 any aberration ETV6 deletion
ARPP21 deletion BTG1 any aberration
HIST1H genes deletion
(n=6)
17% (1/6)
0% (0/6) 0% (0/6) 0% (0/6) 33% (2/6) 0% (0/6) 0% (0/6) 0% (0/6) 0% (0/6) 0% (0/6) 0% (0/6) 0% (0/6) 0% (0/6) 0% (0/6) 17% (1/6) 17% (1/6) 17% (1/6) 0% (0/6) 0% (0/6) 0% (0/6) 17% (1/6) 50% (3/6)** 33% (2/6)* 0% (0/6) 0% (0/6) 0% (0/6) 0% (0/6)
0% (0/6)
(n=5)
40% (2/5)
0% (0/5) 0% (0/5) 0% (0/5) 20% (1/5) 0% (0/5) 0% (0/5) 0% (0/5) 0% (0/5) 20% (1/5) 0% (0/5) 20% (1/5) 20% (1/5) 0% (0/5) 20% (1/5) 60% (3/5) 60% (3/5) 40% (2/5) 0% (0/5) 0% (0/5) 0% (0/5) 0% (0/5) 0% (0/5) 100% (5/5)**** 100% (5/5)**** 40% (2/5)*
60% (3/5)** 40% (2/5)*
(n=4)
33% (1/3)
0% (0/3)
0% (0/3)
0% (0/3)
33% (1/3)
0% (0/3)
0% (0/3)
0% (0/3)
0% (0/3)
0% (0/3)
0% (0/3)
33% (1/3)
33% (1/3)
0% (0/4)
66% (2/3)
33% (1/3)
33% (1/3)
0% (0/3)
0% (0/3)
0% (0/4)
0% (0/3)
0% (0/3)
0% (0/3)
0% (0/3)
0% (0/3)
0% (0/3)
0% (0/3)
33% (1/3)
Only genetic lesions with uneven distribution across acute lymphoblastic leukemia (ALL) subtypes are included.The numbers of analyzed patients vary for individual genetic lesions based on the detection method: 103 patients were analyzed by single-nucleotide polymorphism array (SNPa), 109 were analyzed by RNA-sequencing in diagnostic sam- ple, one patient who was analyzed by RNA-sequencing in relapse sample is not included in this analysis. 1Does not include ZCCHC7-PAX5 fusion. 2Does not include uncommon type of ERGdel identified by SNPa but negative by polymerase chain reaction (PCR) in a single DUX4r-positive case. 3Includes CRLF2r and P2RY8-CRLF2-low. *P≤0.05; **P≤0.01; ***P≤0.001; ****P≤0.0001; by Fisher Exact Probability test for the significant enrichment of genetic lesion in respective subtype compared to all remaining cases.
of BCR-ABL1-like and ETV6-RUNX1-like subtypes with respective genetic groups, we amended the cohort with two BCR-ABL1-positive and nine ETV6-RUNX1-positive ALLs. Eighteen patients had the BCR-ABL1-like pheno- type according to HCA; two of them had iAMP21 and were not included in BCR-ABL1-like ALL for the subse- quent analyses, and the remaining 16 patients were classi- fied as BCR-ABL1-like ALL. Five patients were classified as ETV6-RUNX1-like ALL. Unlike DUX4r and ETV6- RUNX1-positive/-like ALL, BCR-ABL1-like ALL did not co-cluster together in unsupervised HCA, confirming that the gene expression profile of BCR-ABL1(-like) ALL is less unique or specific (Figure 1D).
Overall, the most common B-other ALL subtype was DUX4r ALL (27%), followed by BCR-ABL1-like (15%), ZNF384r (5%), ETV6-RUNX1-like (5%), iAMP21 (4%), and MEF2Dr ALL (2%); the largest proportion of cases
(“B-rest”; n=47, 43%) did not belong to any of these sub- types (Figure 2).
Compared to remaining BCP-ALLs, B-others were more frequently males, older, had higher white blood cell (WBC) count, and worse early response to therapy (Online Supplementary Table S1). Analysis of demographic and clin- ical parameters in the two largest B-other-derived sub- types, DUX4r, BCR-ABL1-like, and B-rest subgroup showed a significantly higher proportion of females in BCR-ABL1-like compared to non-BCR-ABL1-like ALL, while there were no significant differences in age or WBC (Online Supplementary Table S1). Importantly, we found a significantly worse early response to treatment assessed by several criteria in the DUX4r ALL compared to non-DUX4r ALL, resulting in a higher proportion of high- risk patients among the DUX4r ALL (Table 1).
In total, 7 out of 110 B-other ALLs had an MPAL
1400
haematologica | 2019; 104(7)
