
Page 120 - 2019_07 resto del Mondo-web
P. 120
M. Zaliova et al.
A
B
C
D
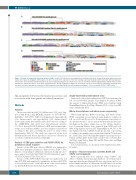
Figure 1. Results of hierarchical clustering analyses (HCA). A total of 110 B-other acute lymphoblastic leukemia (ALL) were clustered hierarchically based on the expression of genes belonging to defined gene sets (A-C) or based on the expression of the most variably expressed transcripts (409 transcripts with standard devi- ations ≥ 35% of the maximal standard deviation) (D) and resulting dendrograms are shown. Gene sets are described in Online Supplementary Tables S4-S5. Genetic annotation is split in two lanes: 1st lane shows classification into already established subtypes, 2nd lane shows selected recurrent genetic aberrations (mutually exclu- sive with each other and with the exception of PAX5 mutations other than P80R also with established subtypes). *Does not include ZCCHC7-PAX5 fusion.
ALL and genetic aberrations, their mutual associations, and associations with demographic and clinical parameters.
Methods
Patients
The present study included 110 children (aged 1-18 years) diag- nosed with B-other ALL [BCP-ALL negative for ETV6-RUNX1, BCR-ABL1, TCF3-PBX1, KMT2A-rearrangements, hyperdiploidy (>50 chromosomes), and hypodiploidy (<44 chromosomes)] between December 2010 and December 2017 treated according to the AIEOP-BFM ALL 2009 trial (clinicaltrials.gov identifier: 01117441). In total, 410 BCP-ALL and/or BCP-myeloid mixed phe- notype acute leukemia (MPAL) cases were diagnosed and treated according to this protocol within the period of study (Online Supplementary Table S1). The study was approved by the local Institutional Review Board. Informed consent was obtained in accordance with the Declaration of Helsinki.
Analysis of ERG gene deletion and P2RY8-CRLF2 by polymerase chain reaction
Presence of the ERG gene deletion (ERGdel) was analyzed by DNA-based multiplex polymerase chain reaction (PCR).31 Two primers corresponding to additional centromeric breakpoint sites32 were added: 5’-GCGGCTACTTGTTGGTCCAAGAA-3’ and 5’- CTATCCTGAACATTGCTGCCAG-3’.
Presence of the P2RY8-CRLF2 transcript was analyzed by real time (RT)-PCR and quantified by quantitative real time (qRT)-PCR as described previously18 with replacement of the reverse primer for qRT-PCR (5’-AGCCTCCCAGCAGAAAGAC-3’).
Single-nucleotide polymorphism array
Single-nucleotide polymorphism array (SNPa) was performed in 103 out of 110 B-other patients. Copy number aberrations (CNA) and regions of uniparental disomy (UPD) were identified using HumanOmni Express BeadChip (Illumina, USA) or CytoScan HD arrays (Affymetrix, USA).
Whole-transcriptome and whole-exome sequencing
Whole-transcriptome (RNA-sequencing) and whole-exome (WES) sequencing were performed using diagnostic samples in 109 out of 110 and 69 out of 110 B-other patients, respectively, as described previously.11 In one patient without material from ini- tial diagnosis, the relapse sample was used for subtype classifica- tion. Sequencing libraries were prepared from DNA and total RNA using Agilent SureSelectXT HumanAllExon V4, V5 or V6 and Agilent SureSelect mRNA Strand Specific kits, respectively, according to the manufacturer’s instructions (Agilent Technologies Inc., Santa Clara, CA, USA). High-throughput sequencing was per- formed on HiSeq2500 (1x50, 2x50 or 2x100 bp) or NextSeq500 (2x75 bp) using TruSeq Rapid SBS and PE Cluster kits and High Output Kit (Illumina).
Selected data metrics are shown in Online Supplementary Tables S2 and S3.
Analysis of fusion transcripts and IGH, DUX4 and CRLF2 rearrangements
RNA-sequencing data were analyzed using TopHat33 and deFuse.34 In-frame fusion transcripts and those out-of-frame fusion transcripts that disrupted known ALL-associated genes and/or cor- related with boundaries of CNAs found by SNPa were selected for further verification. Fusions verified by RT-PCR as leukemia-spe-
1398
haematologica | 2019; 104(7)
