
Page 99 - 2019_06-Haematologica-web
P. 99
Cellular origin and clinical prognostic markers of infant MLLr B-ALL
Interestingly, we found a correlation between the number of mutations and time to relapse in MLL-AF4+ patients, with a trend towards a higher mutational load in patients with late relapses (Online Supplementary Figure S6B). We next analyzed the clonal evolution of RAS-mutated leukemic clones at relapse. We found that the contribution
of the RAS mutations varied among patients: one-third of the iBCP-ALL patients had RAS-mutated clones at relapse (MA4_20 and MA4_22 increased the size of the RAS- mutated initial clone and in MA4_14 a de novo RAS muta- tion emerged), whereas it was lost in two-thirds of the patients (MA4_17, MA4_18, MA4_23, MA4_24) (Figure
A
B
C
D
E
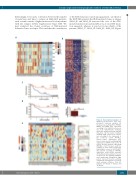
Figure 4. Transcriptional signature of infant B-cell precursor acute lym- phoblastic leukemia samples. (A) Heatmap representing FLT3, PROM1, MEIS1 and HOXA gene expression according to the infant B-cell precur- sor acute lymphoblastic leukemia (iBCP-ALL) cytogenetic group and RAS mutations. (B) Top panel: heatmap showing HOXA cluster gene expres- sion according to the expression of the reciprocal fusion AF4-MLL. Bottom panel: quantitative poly- merase chain reaction validating high expression of HOXA cluster genes in t(4;11) iBCP-ALL patients expressing AF4-MLL. (C,D) Four-year event-free survival (C) and overall survival (D) Kaplan-Meier curves for t(4;11) iBCP- ALL patients according to AF4-MLL expression, n=43 t(4;11)+ patients. (E) Heatmap representation of select- ed genes for the signaling pathways most significantly deregulated. Right panels represent positive pathway enrichment called by gene set enrich- ment analysis software. Total 42 patients: 27 t(4;11)+, 5 t(9;11)+ and 10 MLLwt.
haematologica | 2019; 104(6)
1181
