
Page 97 - 2019_06-Haematologica-web
P. 97
Cellular origin and clinical prognostic markers of infant MLLr B-ALL
nature has also been described in other pediatric tumors, suggesting that iBCP-ALL is not subjected to a specific mutational signature.
We also determined the molecular breakpoint of all MLLr at the base-pair level. In t(4;11)/MLL-AF4+ iBCP- ALL, the AF4 breakpoints were almost invariably localized within intron 3 whereas MLL breakpoints were found between introns 9 and 11 (Online Supplementary Table S4).3 We found whole-genome sequencing reads compatible with an AF4-MLL reciprocal rearrangement in all samples (Online Supplementary Figure S4). AF4-MLL genomic break- points were validated by polymerase chain reaction capil- lary sequencing and they were located nearby MLL-AF4 breakpoints, confirming a reciprocal chromosomal translocation.
RAS-PI3K is the only recurrently mutated pathway in infant B-cell precursor acute lymphoblastic leukemia with NRAS mutations being significantly more frequent in t(4;11)+ patients
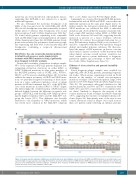
Despite the low number of mutations found per sample, 38% of the sequenced iBCP-ALL patients displayed acti- vating/gain-of-function mutations in either KRAS or NRAS. Additional mutations in other genes members of the RAS-PI3K pathway such as FGFR4, JAK2, PTPN11, SETD2, or FLT3 were also identified (Figure 1B). To further validate the unique recurrence of KRAS and NRAS muta- tions, we performed targeted sequencing of these muta- tions in a large, additional validation cohort of infant patients (n=82) and confirmed that 34% of the iBCP-ALL cases carry mutations in either KRAS or NRAS36 (Figure 2A). Interestingly, the overall frequency of RAS mutations differed slightly between the different cytogenetic sub- groups of iBCP-ALL, with the MLL-AF4+ subgroup show- ing the highest frequency (42%) and the MLL-AF9+ sub- group the lowest (19%). This difference was basically attributed to the frequency of NRAS mutations, which was 6-fold more common in the MLL-AF4+ subgroup
A
BC
(32% vs. 6%, Fisher exact test P=0.01) (Figure 2A,B). Surprisingly, we observed that many iBCP-ALL patients had mutations in both KRAS and NRAS, or more than one (different) mutation in the same gene (Figure 2A,C). To further analyze the biological contribution of KRAS and NRAS mutations, we calculated the MAF of individual mutations and observed that the majority of patients who had a single RAS mutation (either KRAS or NRAS) had MAF scores between 0.20 and 0.45, suggesting that the mutation is present in a major leukemic subclone (P=0.0025). By contrast, those patients harboring two or more RAS mutations displayed MAF scores between 1% and 20%, compatible with these RAS mutations being in distinct and smaller leukemic subclones. We then ana- lyzed the impact of RAS mutations on disease outcome and found no clinical correlation of RAS mutations with either clinical outcome (overall survival, event-free sur- vival, central nervous system infiltration) or diagnostic parameters (gender, age, percentage of blasts and white
blood cells) (Online Supplementary Figure S5).
Evidence of clone selection and genomic instability at relapse
Paired diagnostic-relapse samples were available for eight MLL-AF4+ iBCP-ALL patients, permitting longitudi- nal studies. Whole-exome sequencing revealed an 8-fold increase in the number of somatic non-synonymous mutations at relapse (19.5 mutations/patient, range:1-434, paired t-test P=0.03) (Figure 3A,B and Online Supplementary Table S3). We performed orthogonal validation for 160 random mutations, and 90% and 75% of mutations with MAF >15% and <15%, respectively, were confirmed (data not shown). Similarly to diagnosis, the majority of the somatic mutations found at relapse had MAF commonly <30%, suggesting the existence of multiple leukemic sub- clones (Figure 3A). Importantly, none of the new de novo somatic mutations found at relapse was found in more than one patient, likely reflecting an intrinsic genomic
Figure 2. Frequent somatic mutations in RAS genes in both the discovery and validation cohorts. (A) Specific KRAS and NRAS mutations recurrently found in each patient by high coverage targeted sequencing. (B) Proportions of patients with mutations in KRAS (brown), NRAS (yellow) or both (gray) within the three infant B-cell precursor acute lymphoblastic leukemia subgroups. (C) Mutant allele frequency of KRAS (brown squares) or NRAS (yellow circles) mutations in each individual patient. Discovery cohort, n=42; validation cohort, n=82.
haematologica | 2019; 104(6)
1179
