
Page 64 - 2019_06-Haematologica-web
P. 64
N.U. Stoffel et al.
variables were lower after vaccination, and the decrease in sTfR in the IDA group reached borderline significance (P=0.063). There was a significant group-vaccination inter- action on SF (P<0.001) and BIS (P<0.01).
There was no correlation between IL-6 and SHep at baseline in either group. At 24 h after vaccination, IL-6 and SHep significantly correlated in the non-anemic group
(r=0.426; P<0.05), but did not in the IDA group. In the regressions including all subjects, sTfR, Hb, EPO and IL-6 explained 55% and 62% of the variation of SHep at base- line and at 24 h after vaccination, respectively. At baseline in all subjects, the only significant predictors of SHep were EPO (b=-0.570; P<0.01) and Hb (b=0.372; P<0.05). In con- trast, at 24 h after vaccination, the only significant predic-
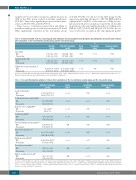
Table 2. Serum interleukin-6 (IL-6), serum hepcidin and erythrocyte iron incorporation (iron absorption and utilization), at baseline and 24 hours after vaccination, in the iron deficiency anemia group and the non-anemic group.
IL-6, pg/mL IDA
Non-anemic
Serum hepcidin, nM IDA
Non-anemic
Erythrocyte iron incorporation, % IDA
Non-anemic
Baseline (n=46)
1.53 (1.41 - 1.81) 1.12 (0.92 - 1.66)
0.45 (0.23-0.61)*
1.60 (0.93 - 2.86) 36.15 (26.08 - 39.35)*
16.66 (9.33 - 24.05)
24h after vaccination (n=43)
3.14 (2.48 - 4.33)° 3.37 (2.88 - 4.32)°
0.45 (0.32 - 1.17)*
3.56 (1.04 - 5.53)° 33.09 (28.84 - 38.74)*
15.89 (11.86 - 24.71)
Group effect
0.212
<0.001
<0.001
P
Vaccination effect
<0.001
<0.001
0.396
Group-vaccination effect
0.349
0.810
0.629
h: hours; n: number; IDA: iron deficient anemia. Medians [interquartile range (IQR)]. *Different between groups (P<0.001). °Within group, different from baseline (P<0.001). Analyzed by linear mixed models with Bonferroni-corrected multiple comparisons.
Table 3. Iron and inflammatory variables 24 hours after vaccination, in the iron deficiency anemia group and the non-anemic group. P
Serum ferritin, μg/L* IDA
Non-anemic
Serum transferrin receptor, mg/L*
IDA
Non-anemic
Body iron stores, mg/kg BW** IDA
Non-anemic
Transferrin saturation, %* IDA
Non-anemic
Erythropoietin, mIU/mL* IDA
Non-anemic
C-reactive protein, mg/L*
IDA
Non-anemic
Alpha-1-acid glycoprotein, g/L* IDA
Non-anemic
24h after vaccination (n=43)
ⱡ 10.89 (6.86, 17.30)ⱡ
14.98 (7.31, 30.70)
6.60 (4.73, 9.22)$ 5.32 (3.98, 7.11)
0·63 ± 2·28$ⱡ 2·26 ± 3·30
0·59 (0.38, 0.93)$ 0·78 (0·59, 1·02)#
4.89 (4.69-5.13) 4.71 (4.47-5.16)
12.01 (7.60, 18.97)$ 16.23 (12.39, 21.26)
21.95 (12.62, 38.17)¶ 9.59 (6.23, 14.78)
ⱡ
Group effect
<0.001
<0.001
<0.001
<0.001
0.284
<0.001
<0.001
0.499
0.248
Vaccination effect
0.716
<0.01
0.175
0.971
0.116
0.637
0.057
<0.05
<0.001
Group-vaccination effect
<0.001
0·357
<0·01
<0·01
0·827
<0·05
0·876
0.138
0.293
Non-anemic
Serum iron, μg/mL* IDA
Non-anemic
Total iron binding capacity, μg/mL*** IDA
0.27 (0.10, 0.69)
0.45 (0.16, 1.26) 0.45 (0.33, 0.61)°
0.52 (0.38, 0.72)ⱡ
h: hours; n: number; IDA: iron deficient anemia. *Geometric mean [-Standard Deviation (SD), +SD]. **Mean±SD. ***Median [interquartile range (IQR)]. ¶Different between groups (P<0.001). $Different between groups (P<0.05). °Within group, different from baseline (P<0.001) (baseline values shown in Table 1). ⱡWithin group, different from baseline (P<0.01) (baseline values shown in Table 1). #Within group, different from baseline (P<0.05) (baseline values shown in Table 1). Analyzed by linear mixed models with Bonferroni-corrected multiple comparisons.
1146
haematologica | 2019; 104(6)
