
Page 63 - 2019_06-Haematologica-web
P. 63
Iron, absorption, hepcidin, anemia, inflammation
nation interaction (Table 2). There were significant between-group differences in SHep measured at 4:00 pm and at 8:00 am before vaccination and at 8 h, 24 h, and 36 h after vaccination (all P<0.05) (Figure 2B). In the non-ane- mic group, median IQR SHep (nM) significantly increased from 1.60 (0.93-2.86) before to 3.56 (1.04-5.53) at 24 h after vaccination (P<0.001). In contrast, in the IDA group, vaccination did not induce a significant increase in SHep: median (IQR) SHep (nM) was 0.45 (0.23-0.61) before and 0.45 (0.32-1.17) 24 h after vaccination (Table 2).
There was a significant group effect (P<0.001) and group-vaccination interaction (P<0.001) on serum iron and transferrin saturation (TSAT), but no significant vaccina- tion effect (Table 3). There were significant between- group differences in serum iron and TSAT at baseline (P<0.001 for both) and at 24 h after vaccination (P<0.05 for both). In the non-anemic group, geometric mean [-Standard Deviation (SD), +SD] serum iron (μg/mL) sig- nificantly decreased from 0.91 (0.71, 1.17) before to 0.78
(0.59, 1.02) at 24 h after vaccination (P<0.05) (Figure 3A). Geometric mean (-SD, +SD) TSAT (%) decreased from 19.19 (14.69, 25.07) before to 16.23 (12.39, 21.26) at 24 h after vaccination (P=0.066). In the IDA group, vaccination had no significant effect on either serum iron or TSAT.
There was a significant group effect on FIA (erythrocyte iron incorporation) (P<0.001), but no significant vaccina- tion effect or group-vaccination interaction (Table 2). Comparing erythrocyte iron incorporation before and after vaccination, there were no significant differences within either of the two groups (Figure 3B). However, between groups, erythrocyte iron incorporation was sig- nificantly higher (by approx. 2-fold) in women with IDA both before and after vaccination (Table 2).
Iron and inflammation indicators at 24 h after vaccina- tion are shown in Table 3. There was a significant group effect on SF, sTfR, BIS, EPO (P<0.001), but none on CRP or AGP. There was a significant vaccination effect on sTfR (P<0.01), CRP (P<0.05) and AGP (P<0.001); all of these
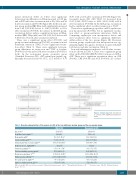
Figure 1. Study design. IDA: iron deficien- cy anemia; DTP: diphtheria-tetanus-per- tussis.
Table 1. Baseline characteristics of the women (n=46) in the iron deficiency anemia group and the non-anemic group.
Age, years*
IDA (n=21)
23 (21-27)
22.9±2.5
11·3 (10.7-11.6)
6·3 (3.9, 10.3)
8·33 (6.08, 11.43)
-2.5±2.7
0·51 (0·33, 0.78)
4·79 (4·49-5.06)
10·78 (6·89, 16.89)
20·37 (11.48, 36.17)
0·70 (0.18, 2.76)
0·71 (0.51, 0.98)
Non-anemic (n=25)
24 (23-30)
22.3 ± 3.1 13·3 (12.6-13.9) 23·8 (10.7, 52.9) 5·99 (4.60, 7.79) 3.5±3.5
0.91 (0.71, 1.17) 4.81 (4.41-5.01) 19.19 (14·69, 25.07) 8.61 (5.40, 13.74) 0.59 (0.13, 2.59) 0.72 (0.49, 1.05)
Body Mass Index, kg/m2** Hemoglobin, g/dL*
Serum ferritin, μg/L***
Serum transferrin receptor, mg/L*** Body iron stores, mg/kg BW** Serum iron, μg/mL***
Total iron binding capacity, μg/mL*
Transferrin saturation, %***
Erythropoietin, mIU/mL***
C-reactive protein, mg/L***
Alpha-1-acid glycoprotein, g/L***
BW: body weight; IDA: iron deficiency anemia. *Median [interquartile range (IQR)]. **Mean±Standard Deviation (SD). ***Geometric mean (-SD, +SD). ¶Different between groups (P<0.001).
haematologica | 2019; 104(6)
1145
