
Page 58 - 2019_06-Haematologica-web
P. 58
Y. Hirata et al.
highly expressed CD39 and CD73 as compared to the rest of the CD4+ nonTreg (CD150neg-low) (Figure 3B-D, Online Supplementary Figure S3B). CD150high populations com- prised 20% of CD4+ nonTreg and 40% of Treg (Figure 3E). CD150high nonTreg frequently showed a CD44highCD62Llow effector memory phenotype as compared to the rest of the CD4+ nonTreg (CD150neg-low) (Figure 3F; Online Supplementary Figure S3C), which is consistent with our previous observations in CD150high Treg.7 The frequencies of CD39high and CD73high cells among CD150high nonTreg were equivalent to those among CD150high Treg, and high-
A
B
er than those in BM CD150low Treg, BM CD150neg-lowCD4+ nonTreg, and lymph node CD4+ nonTreg (Figure 3B,D, Online Supplementary Figure S3A,D).
CD39 and CD73 expression among CD45- mesenchy- mal cells was further analyzed following division of the CD45- cells into the following three populations; CD45- CD31+ vasculature; CD45-CD31-CD140a+CD140b+ cells; and CD45-CD31-CD140a-CD140b- cells (Online Supplementary Figure S3E). Previous studies suggested that the former two populations were putative cellular con- stituents of the HSC niche.2,3 CD45-CD140a+CD140b+ cells
CDE
FGH
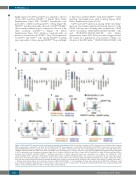
Figure 3. CD39 and CD73 expression levels in various bone marrow cell populations. (A) Flow cytometric analysis of CD73 expression levels in different bone marrow (BM) cell populations: regulatory T cells (Treg: CD4+CD3+NK1.1-FoxP3YFP+; non-regulatory T cells (nonTreg: CD4+CD3+NK1.1-FoxP3YFP-); hematopoietic stem cells (HSC: CD150+CD48-cKit+Sca1+Lin-); hematopoietic stem and progenitor cells (HSPC: cKit+Sca1+Lin-); CD8 cells (CD8+CD3+NK1.1-); natural killer cells (NK: NK1.1+CD3-); CD4NKT cells (NK1.1+CD3+CD4+ NKT cells); and B cells (B220+ cells). (B) Frequencies of CD73high and CD73int cells in different BM cell populations with the thresholds of CD73 expression levels determined as shown in Figure 3A, D, G and H: CD150H Treg (CD150high Treg); CD150L Treg (CD150low Treg); CD150H nonTreg (CD150high nonTreg); and CD150N-L nonTreg (CD150neg-low nonTreg). Thresholds of CD150 expression levels were determined as in Figure 3E. CD140a/b+: CD45- CD140a+CD140b+CD31-. CD140a/b-: CD45-CD140a-CD140b-CD31-. CD31+: CD45-CD31-CD140a-CD140b-. The results were reproducible in two independent experi- ments (n=6). A representative figure is shown here. Data are presented as mean ± SD. (C) Representative histograms showing levels of CD150 expression on HSC, Treg, and CD4+ nonTreg. (D) Representative histograms showing levels of CD39 or CD73 expression on CD150high Treg, CD150low Treg, CD150high nonTreg, and CD150neg- low nonTreg. (E-F) Representative flow cytometric dot plots of BM CD4+CD3+NK1.1- T cells including both Treg and nonTreg (E) and BM CD4+ nonTreg (F). (G-H) Representative histograms showing levels of CD39 and CD73 expression of CD150 high Treg, CD150low Treg, CD140a+CD140b+CD45-CD31- cells, CD140a-CD140b-CD45- CD31- cells (G), and CD31+CD45- cells (H). Iso ctrl Ab: isotype control antibody.
1140
haematologica | 2019; 104(6)
