
Page 57 - 2019_06-Haematologica-web
P. 57
CD73 regulates HSC quiescence
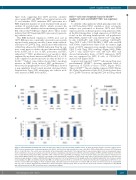
Figure S2A), suggesting that CD73 prevents oxidative stress against HSC and HSPC but not against mature cells. To test whether CD73 maintains HSC quiescence in a ROS-dependent manner, we used treatment with an anti- oxidant, N-acetylcysteine (NAC), which reversed the increases in HSC numbers and reconstituting potential of BM cells in CD73 KO mice (Figure 2B,C). These results indicate that CD73 maintains HSC quiescence by prevent- ing oxidative stress.
This ROS-mediated expansion of HSC pool size in CD73 KO mice was consistently observed in our recently reported study, using two models: (i) mice with condition- al deletion of CD39 in Treg; and (ii) mice with reduction of BM Treg achieved by CXCR4 deletion in Treg.7 In con- trast, some previous studies showed that increased ROS levels in HSC led to loss of HSC quiescence, and HSC exhaustion.11-13 HSC proliferation in our models is likely explained by moderate increases in ROS levels (1.2- to 1.5- fold) compared to greater increases in other models (3- to 5-fold).11-13 Indeed, some studies showed that a moderate increase in ROS levels induced HSC proliferation.14,15 Moreover, the peripheral blood of CD73 KO mice showed a non-significant trend toward myeloid skewing (Online Supplementary Figure S2B), which may also reflect a mod- erate increase in ROS levels in HSC.
CD73high cells were frequently found in CD150high regulatory T cells and CD150highCD4+ non-regulatory T cells
To identify cell populations which play important roles in CD73-mediated HSC regulation, flow cytometric analysis was performed to measure CD73 and CD39 expression levels on hematopoietic cell populations with- in the BM. Intermediate to high expression of CD39 was found on the following hematopoietic cell populations: HSC; HSPC; CD11b+Gr1int cells; CD11b+Gr1high cells; B220+ B cells; CD4+FoxP3- cells (CD4+ nonTreg); CD4+FoxP3+ Treg; CD8+ T cells; CD4+CD3+NK1.1+ NKT cells; and NK cells (Online Supplementary Figure S3A). In contrast, high levels of CD73 expression were mainly observed within CD4+ T cells (Treg, CD4+ nonTreg) (Figure 3A,B). While CD8+ T cells, CD11b+Gr1high cells, and CD4+ NKT cells showed intermediate levels of CD73 expression, CD73 was not expressed by HSC, B cells, or CD11b+Gr1int myeloid cells (Figure 3A,B).
As previously reported,7 CD73high cells among Treg were predominantly CD150high, showing equivalent levels of expression of CD150 as those of HSC (Figure 3B-D). These CD150high Treg also highly expressed CD39 (Figure 3D, Online Supplementary Figure S3A). Notably, there were also CD150high fractions among BM CD4+ nonTreg, which
AC
B
Figure 2. CD73 maintains hematopoietic stem cell quiescence and pool size by preventing oxidative stress. (A) Flow cytometric analysis of reactive oxygen species (ROS) levels in hematopoietic stem and progenitor cells (HSPC: cKit+Sca1+Lin-) and hematopoietic stem cells (HSC: CD150+CD48-cKit+Sca1+Lin-) in CD73 knockout (KO) or control B6 mice. The results were reproducible in two independent experiments (7 mice/group total). A representative figure from one independent experi- ment is shown here. Data are presented as mean ± SD and were analyzed by a two-tailed t-test. (B) Flow cytometric analysis of HSPC and HSC numbers in CD73 KO mice treated with N-acetylcysteine (NAC). CD73 KO or B6 control mice were given NAC (100 mg/kg) or mock treatment (daily; subcutaneously) for 4 weeks prior to bone marrow (BM) isolation. The results were reproducible in two independent experiments (7 mice/group total). Data are presented as mean ± SD and were ana- lyzed by one-way analysis of variance (ANOVA) with a Bonferroni post-test. (C) Donor chimerism in the peripheral blood of lethally irradiated SJL mice that were admin- istered wildtype SJL BM cells (CD45.1) together with BM cells of NAC-treated CD73 KO or control B6 mice (CD45.2) 5 months after transplantation. CD73 KO or con- trol mice received NAC (100 mg/kg) or mock treatment (daily; subcutaneously) for 4 weeks prior to isolation. BM cells from each donor mouse were transplanted into one or two recipients. Experiments included three donors and 11-12 recipients/group. Data are presented as mean ± SD and were analyzed by one-way ANOVA with a Bonferroni post-test. MFI: mean fluorescence intensity; wt: wildtype.
haematologica | 2019; 104(6)
1139
