
Page 182 - 2019_06-Haematologica-web
P. 182
J.P. Van Geffen et al.
microspots M1 and M5. Interestingly, the rs2363877 allele linked to increased thrombus parameters at M1 was also associated with high CD9 levels, but low platelet VWF levels.24 Altogether, these analyses identified novel varia- tion in platelet thrombus parameters associated with GP6 signaling for GPVI/collagen-dependent platelet adhesion (P1) and activation (P6-8).
Thrombus signature based on parameters of platelet aggregation
To further evaluate the inter-subject differences in thrombus formation, blood was obtained from three patients with Glanzmann thrombasthenia (confirmed mutations in ITG2B, defective integrin αIIbb3 expression), two patients with delta storage pool disease (reduced dense granule secretion), and three healthy day-control subjects. Application of the multiparameter test with the patients’ blood samples revealed identifiable patterns of altered thrombus formation on all microspots (raw data in
Data File 1D). Interestingly, the altered patterns seen with the three Glanzmann samples (Online Supplementary Figure S1A-C) reinforced the earlier PCA results that, across microspots, the values of P2-5 (and to a lesser extent P8) tended to cluster. All of these parameters relate to platelet aggregation and contraction, i.e. platelet functions known to be impaired in these patients. For the patients with stor- age pool disease, similar but less striking patterns of changes were observed (Online Supplementary Figure S1D,E).
Subsequently, we determined whether this cluster of parameters also provides information on the thrombus signature for healthy subjects. The summative scaled value Σ(P2-5, P8) was calculated per microspot and for all microspots. Supervised clustering, ranking the 94 subjects according to this summation, did indeed point to patterns of high and low platelet aggregation, which extended over multiple microspots (Figure 6A). For the three Glanzmann patients, these summative values were very low, as
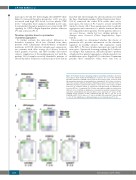
Figure 5. Prediction models explaining variation in thrombus formation. (A) Partial least squares (PLS) models determining the covariance for each of the individual thrombus parameters (M1-M6, P1-P8) and all other platelet traits. Fourteen (from 48) parameters showed a relevant prediction, capturing 0.2-10.9% (blue color inten- sity) of the variation. (B) Beta matrix per individual parameter for the PLS models of GPVI-induced platelet activation (unit variance scaled, mean centered data): (i) GPVI- induced αIIbb3 activation (A3-Int, 2 components orthogonal PLS); (ii) GPVI-induced secretion (A3-Sec, 1 component PLS). Positive and negative weights are indicated by different colors. (C) Matrix of significance per parameter (quantile normalized linear regression, and likelihood ratio test per allelic score), expressed as P values, for the following genetic variants: (i) GP6, rs1613662 (AA, GA, GG; n = 63, 29, 1); (ii) FCER1G, rs3557 (TT, TG, GG; n = 67, 24, 2); (iii) VWF-CD9, rs2363877 (GG, GA, AA; n = 20, 47, 26). Significance is indicated by green color intensity and *P<0.05.
1264
haematologica | 2019; 104(6)
B
C
A
