
Page 180 - 2019_06-Haematologica-web
P. 180
J.P. Van Geffen et al.
activation and secretion in response to either ADP (A2) or CRP-XL (A3) and, to a lesser extent, in response to TRAP (A4) (Figure 3C,D). A clear relationship was present between GPVI expression level and CRP-XL-induced acti- vation markers (P=0.010 for integrin activation; P<0.0001 for secretion). Furthermore, except for TRAP-induced secretion, all platelet activation markers were associated with glycoprotein expression levels (median P=0.010) and, to a certain extent, with platelet size. Taken together, these results pointed to a subject-dependent component of platelet size and activation, independent of the type of agonist.
Comparative analysis of parameters of thrombus formation with other platelet traits
Principle component analysis (PCA), using the dataset of 94 subjects, was performed to further analyze the relation-
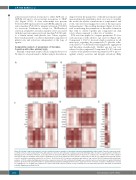
ships between the parameters of thrombus formation and measured platelet quantitative traits. As a way to visualize the results, the relative contributions of components 1 and 2 (C1, C2) were heat mapped for each of the microspots and parameters. The resulting heatmaps (Figure 4) can be read as indicating the parameters of thrombus formation that tend to cluster together per component (in dark color), when compared to other sets of variables.
PCA was first applied to compare parameters P1-8 for each microspot with subjects’ age and sex (Figure 4A). Component 1 (91.1%) showed a high correlation for all microspots regarding the parameters P1 (platelet adhe- sion) and P2-5 (collectively reflecting platelet aggregation and thrombus morphology). Neither age nor sex con- tributed to this component. Component 2 (1.5%) showed a cluster of the platelet activation parameters P6-8 (proco- agulant activity, secretion and integrin activation). Only
Figure 4. Principal component analysis to reveal correlations between variables of thrombus formation and quantitative platelet traits. Principle component analy- ses (PCA) of mean centered data from 94 healthy subjects (cohort 2), after univariate scaling as represented in Figure 2B,C. In order to reveal patterns of jointly con- tributing factors to thrombus formation, scaled data from six microspots (M1-6) and eight parameters (P1-8) were combined in a PCA with sets of other variables from the 94 subjects. Heatmaps show relative contributions of each of the parameters to the first two components, C1 and C2. For coding of microspots (M), param- eters (P), and platelet activation markers (A), see Table 1. (A) PCA of the M × P matrix in combination with subjects’ age and sex. (B) PCA combined with hematologic variables. (C) PCA combined with glycoprotein surface expression levels. (D) PCA combined with integrin αIIbb3 activation and secretion markers of agonist-stimulated platelets. (E) PCA of only activation markers of agonist-stimulated platelets with glycoprotein surface expression levels. Color bars of relative contributions to C1 and C2, ranging from 0 to 1. White boxes indicate no relation, while dark red boxes indicate a large contribution for the indicated parameters. Raw data are presented in Online Supplementary Data File 2E.
1262
haematologica | 2019; 104(6)
C
DE
AB
