
Page 177 - 2019_06-Haematologica-web
P. 177
High-throughput elucidation of thrombus formation
following stimulation via P2Y1/12 receptors (with ADP), GPVI (CRP-XL), or the PAR1 thrombin receptor (TRAP) in the presence of aspirin and apyrase (where appropriate), to suppress autocrine-dependent secondary activation. For these platelet traits, heat mapping of the scaled values again showed major inter-individual differences (Figure 2C), similarly as previously described.23
Comparative analysis of high-throughput parameters
For systematic evaluation of the eight parameters of thrombi formed on six microspots for the 94 subjects, we performed a correlational analysis across all microspot and parameter combinations. As shown in Figure 3A,B, the majority of parameters tended to correlate positively per microspot, suggesting a 'thrombus profile' represented by multiple parameters (median P values for all 6 microspots
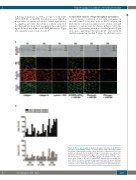
Figure 1. Microscopic imaging of platelet thrombus formation on six different microspots and variability analysis. (A) Representative images after flow of whole blood from a representative healthy subject over series of microspots M1-6 (com- position as indicated). For the brightfield images, scored values are indicated for parameters P3 (thrombus morphological score), P4 (thrombus multilayer score), and P5 (thrombus contraction score). Bars, 20 μm. The definition of all parame- ters is given in Table 1. (B) Three separate blood samples from ten healthy sub- jects (cohort 1), taken at intervals of 2-4 weeks, were used to assess thrombus formation on microspots M1, M2, and M6. Intra- and inter-individual coefficients of variance (CV) are plotted per microspot and parameter. PS: phosphatidylserine.
haematologica | 2019; 104(6)
1259
A
B
