
Page 175 - 2019_06-Haematologica-web
P. 175
High-throughput elucidation of thrombus formation
Introduction
Whole-blood-based microfluidics methods, measuring thrombus formation under flow, are increasingly used as proxy measurements for in vivo models of thrombosis. Such flow assays provide valuable mechanistic informa- tion on the consequences of loss-of-function or gain-of- function mutations of key platelet signaling proteins for arterial thrombosis and hemostasis.1-4 Until recently, colla- gen-coated surfaces were used for such measurements, so as to approximate common collagen-dependent models of arterial thrombosis in vivo.5,6 Recently, we showed that by using multiple, microspotted surfaces this method can be extended to multiparameter measurements of thrombus formation,7 thus elucidating platelet dysfunction in patients with a range of bleeding diatheses.7-9
Commonly, detection of an heritable or acquired platelet function impairment is made by conventional approaches, such as light transmission aggregometry,10, 11 flow cytometry,12 and the PFA-100.13 However, such tests are limited by a low throughput and requirement of rela- tively large volumes of blood, if multiple agonists at vari- ous concentrations need to be tested. These limitations can be overcome by higher-throughput, well-plate-based tests of platelet aggregation or flow cytometric analysis.14,15 For the multiparameter measurement of thrombus forma- tion, however, still little is known about the detection capability to identify (small differences in) platelet pheno- types in healthy subjects and groups of patients.
Two recent whole genome association studies have identified over 640 independent single nucleotide variants
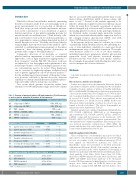
Table 1. Overview of microspot surfaces (M) and parameters (P) in flow assays; as well as platelet activation (A) markers in flow cytometry.
that are associated with quantitative platelet traits (count, mean volume, distribution width of mean volume, and mass or crit).16,17 Several of the variants appeared to be linked to alterations in platelet activation tendency, in par- ticular by using flow cytometric assessment of agonist- induced integrin αIIbb3 activation and P-selectin expression (measuring platelet secretion) in the genotyped individu- als. Detailed studies revealed single nucleotide variants which associated with altered platelet expression levels of the collagen receptor, glycoprotein (GP)VI, and with altered GPVI-induced activation responses.18-20
In the present study we aimed to evaluate, in a cohort of genetically defined healthy subjects, the underlying rea- sons of inter-individual variability in a microspot-based multiparameter assay of thrombus formation. The results were therefore related to a set of 24 other variables, including hematologic parameters, platelet glycoprotein expression levels and platelet activation markers. Prediction models were built to link specific variables. Blood samples from patients with bleeding disorders were used to interpret the observed relations.
Methods
A detailed description of the methods is available in the Online Supplement.
Blood donors and blood collection
Studies were approved by the Maastricht University Medical Center Ethics Committee and the Cambridge East Research Ethics Committee (Genetic analysis of platelets in healthy individuals, REC ref 10/H0304/65). Healthy subjects (laboratory population) in cohort 1 (n=10) donated three blood samples at 2- to 4-week inter- vals. Genotyped healthy subjects (cohort 2, n=94) were analyzed in a period of 2 weeks. These subjects were registered in the National Institute for Health Research (NIHR) BioResource (Unicorn-2 study). Genotyping of subjects in cohort 2 was per- formed as described elsewhere.20 The subjects’ demographics are indicated in Online Supplementary Table S1.
Included patients had confirmed Glanzmann thrombasthenia: GT1: ITGA2B c.[2943G>A], [2943G>A], p. (=) (homozygous splice mutation); GT2: ITGA2B c.213C>G; p.P71A, c.2051T>G, p.L684A (compound heterozygous point mutations); GT3: ITGA2B, c.621C>T; p.T176I (homozygous point mutation). Two other patients had a confirmed quantitative delta-storage pool dis- ease (reduced mepacrine capture/release): SPD1, SPD2. All patients and the three day-control subjects had normal blood cell counts (Online Supplementary Data File 1D).
High-throughput microfluidics
Microspot surface
M1 collagen type I (VWF)*
M2 collagen type III (VWF)*
Platelet receptors involved
M3 VWF+laminin
GPIb+αb2 1 61
M4 VWF-BP + GFOGER-(GPO) GPIb + GPVI, α b
GPIb, GPVI, α b
GPIb, GPVI, α2b1
M5 VWF-BP + rhodocytin
M6 VWF-BP + fibrinogen
Brightfield / Fluorescence parameters
P1 platelet surface area coverage (%SAC)
P2 platelet aggregate (%SAC)
P3 thrombus morphological score
P4 thrombus multilayer score
P5 thrombus contraction score
P6 PS exposure (%SAC)
Range
0 – 66.47
0 – 47.84 0–5 0–3 0–3 0 – 22.71 0 – 63.44 0 – 48.05
GPIb + αIIbb3 Normalized
0–10
0–10 0–10 0–10 0–10 0–10 0–10 0–10
Glass coverslips were coated with three microspots of 0.5 μL (3 mm center-to-center distance) using a high-precision mold. Using two sets of coverslips, a total of six different microspots (M1-6) were applied for whole-blood perfusion (see Table 1). Microfluidics assays were performed as described previously,7 with minor modifications. Details of the standard operating pro- cedures are provided in the Online Supplement. Post-staining of thrombi was performed with FITC-labeled anti-fibrinogen mono- clonal antibody (1:100, Dako, F0111, Santa Clara, CA, USA), Alexa Fluor (AF)568 annexin A5 (1:200, Molecular Probes), and AF647 anti-CD62P monoclonal antibody (1:80, Biolegend, London, UK). Representative brightfield and tri-color fluorescence images were taken with an EVOS-FL microscope (Life Technologies), equipped with GFP, RFP and Cy5 dichroic cubes
n21 GPIb + CLEC-2
P7 secretion (P-selectin positive, %SAC)
P8 integrin α b activation (%SAC) IIb 3
Flow cytometry activation (A), secretion (Sec), integrin αIIbb3 activation (Int)
A1 unstimulated
A2 ADP-stimulated
A3 CRP-XL-stimulated
A4 TRAP-stimulated
*(VWF), von Willebrand factor from plasma.
A1-Sec, A1-Int
A2-Sec, A2-Int A3-Sec, A3-Int A4-Sec, A4-Int
haematologica | 2019; 104(6)
1257
