
Page 96 - 2019_04-Haematologica-web
P. 96
R. Bernardoni et al.
any significant phenotype (Figure 7C), indicating that only when BCR-ABL1 is expressed when prohemocytes enter quiescence is it able to increase hematopoiesis. Consistently, constitutive expression of the kinase-dead mutant BCR-ABL1KD did not induce any significant pheno- type (Figure 7C). Since dAbl, like Dab and ena, is expressed in the lymph gland,43 we assessed whether decreased dAbl function is able to rescue the phenotype. We co-expressed BCR-ABL1 and Abl-RNAi, and observed a significant
AB
decrease of the phenotype penetrance (Figure 7E). We then investigated whether Dab or ena downregulation interacts genetically with BCR-ABL1 expression during hematopoiesis as well. Dab-RNAi in the medullary zone starting from L2 was able to enhance the melanotic nodule phenotype, inducing a significant increase of the pene- trance (Figure 7F). Consistently, larvae co-expressing Dab (UAS-Dab) and BCR-ABL1 in the medullary zone starting from L2 showed phenotypic suppression (Figure 7F).
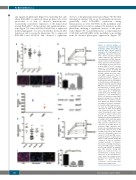
Figure 6. Altered pattern of expression of the human Disabled homologs, Dab1 and Dab2, in patients with chronic myeloid leukemia. (A) Downregulation of Dab1 RNA expression in patients with chronic myeloid leukemia (CML) compared to the expression in healthy donors (CTRL). In partic- ular we found a 1 log reduction of Dab1 expression in both peripher- al blood (PB) (P<0.01) and bone marrow (BM) (P<0.01) (median values 2-ΔΔct: 0.02 versus 0.3 in PB and 0.008 versus 0.04 in BM). (B) Expression pattern of Dab1 in CML patients during molecular remis- sion (MR) compared to that in treatment-resistant patients. (C) Immunofluorescence staining of Dab1 protein (red) in PB samples of healthy donors, CML patients at diagnosis and CML patients during MR. Nuclei are stained in blue. (D) Quantification of Dab1 protein expression in the immunofluores- cence assay. (E) A 3H-thymidine proliferation assay showing a 20% reduction of cell proliferation in K562 cells transfected with Dab1 plasmid compared to control. (F) Western blot of protein extracts from K562 cells transfected with an empty vector (lane 1) and trans- fected with a Dab1 expression vec- tor (lane 2), showing detectable expression of Dab1 only in K562 cells transfected with the Dab1 vector. Independent loads of equal amounts of protein extract were probed with antibodies raised against BCR, Dab1 and GAPDH as a loading control. (G) Down-regula- tion of Dab2 RNA expression in CML patients compared to the expression in healthy donors. In particular Dab2 expression was found to be statistically decreased (P<0.0001 and P<0.0001 in PB and BM, respectively) with median values of 0.12 versus 2.8 and 0.12 versus 0.7 in PB and BM, respec- tively. (H) Pattern of expression of Dab2 in CML patients during MR compared to that in treatment- resistant patients. (I) Immuno- fluorescence staining of Dab2 pro- tein (red) in PB samples of healthy donors, CML patients at diagnosis and CML patients during MR. Nuclei are stained in blue. (J) Quantification of Dab2 protein expression in an immunofluores- cence assay. The statistical com- parisons were conducted using a Student t test (*P<0.05, **P<0.01, ****P<0.0001). Bars indicate the standard error.
CD
EF
GH
IJ
724
haematologica | 2019; 104(4)
