
Page 45 - 2019_04-Haematologica-web
P. 45
PGE2, EGF, FLT3L and TPO in human hematopoiesis
increased mRNA levels of the anti-apoptotic protein MCL-1 and the pro-apoptotic protein BIM while BMF lev- els were reduced. mRNA levels returned to normal at 12 h of treatment. Other BCL-2 proteins were not transcrip- tionally regulated at either time point (Online Supplementary Figure S2A and B).
As we observed no HSPC expansion when cells were
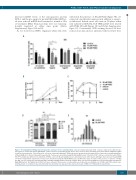
cultured in the presence of 50 mM PGE2 (Figure 3B), we suspected a proliferation repression in addition to apopto- sis induction. Indeed, more cells were in G0 phase when cells cultured with FLT3L, SCF, TPO and IL3 were treated with PGE2 (50 mM) (Figure 3D and Online Supplementary Figure S3). Consistently, CFSE staining showed 4-5 divi- sions in four days in most untreated cells but fewer divi-
A
BC
DE
Figure 3. Prostaglandin E2 (PGE2) has both protective and toxic effects on human CD34+ cells. (A) Cord blood-derived CD34+ cells were subjected to different cyto- toxic agents or serum and cytokine withdrawal. Control cells were treated with serum, FLT3L, stem cell factor (SCF), thrombopoietin (TPO) and IL3. PGE2 was added at indicated concentration. After 48 hour (h), cells were stained with AnnexinV/7AAD and specific apoptosis was determined. Bars represent means±Standard Error of Mean (SEM) of 5-6 from 6 independent experiments. P-values were determined using the Mann-Whitney test. (B and C) CD34+ cells were cultured in serum, FLT3L, SCF, TPO and IL3 plus different concentrations of PGE2. Cell count (B) and viability (C) were determined every other day for eight days. Bars represent means±SEM of 4 from 3 independent experiments. P-values were determined using the Mann-Whitney test. (D) After three days of culture in the presence or absence of PGE2 (50 mM), cell cycle status was determined by Ki67 and DAPI staining and flow cytometric analysis. Bars represent means±SEM of 6 from 5 independent experiments. Mann-Whitney test. (E) PGE2-treated CD34+ cells were cultured in the presence of carboxy-fluorescein diacetate succinimidyl ester (CFSE), and CFSE content repre- senting amount of cell divisions was determined by flow cytometry four days later. Bars represent means ± SEM of n=3 independent experiments.
haematologica | 2019; 104(4)
673
