
Page 224 - 2019_04-Haematologica-web
P. 224
M.A. Pulsipher et al.
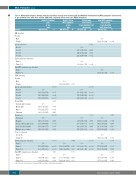
Table 4. Multivariate analysis showing other key predictors for long-term skeletal pain and Modified Toxicity Criteria (MTC) symptoms and recovery to pre-donation level after bone marrow (BM) and peripheral blood stem cells (PBSC) donations.
Grade 2-4 skeletal pain
at one
Grade 2-4 max MTC symptoms at one
Skeletal pain non-recovery
to pre-donation level
Max MTC symptoms non-recovery
to pre-donation
year
OR(95%CI) P OR(95%CI) P OR(95%CI) P OR(95%CI) P
year
at one year
level at one year
Variable
BM donation Gender
Male
Female
Age at collection
18 to 29 30to39 40to49 50to59
Skeletal pain pre-donation Grade 0
Grade 1-4
Max MTC symptoms pre-donation
Grade 0
Grade 1-4 PBSC donation Gender
Male
Female
Age at collection (years)
18 to 29 30to39 40to49 50to60
Donor BMI Underweight / normal Overweight
Obese
Unknown
Donor race
Caucasian
Hispanic
African / African American Asian / Pacific Islander Multiple races / other
Year of collection 2010-2011 2012-2013
Skeletal pain pre-donation
Grade 0 Grade 1 Grade 2-4
1.00
1.92 (1.35-2.74)
<0.001
1.00
1.13 (0.78-1.63) 1.42 (0.95-2.12) 2.21 (1.34-3.64)
1.00
0.39 (0.20-0.74)
1.00
1.50 (1.21-1.86) 1.78 (1.43-2.22) 2.18 (1.71-2.78)
1.00
1.14 (0.85-1.54) 2.05 (1.40-3.00) 1.22 (0.87-1.71) 1.52 (1.11-2.08)
1.00
0.53 (0.40-0.71) 0.22 (0.11-0.45)
0.012
0.521 0.091 0.002
0.004
<0.001
<0.001 <0.001 <0.001
0.001
0.377 <0.001 0.243 0.009
<0.001
<0.001
<0.001
1.00
0.29 (0.11-0.72)
0.008
1.00
1.61 (1.15-2.25)
0.005
1.00
1.81 (1.19-2.74) 1.85 (1.22-2.82) 2.72 (1.77-4.16)
1.00
1.36 (0.95-1.95) 1.79 (1.25-2.57) 0.96 (0.31-2.94)
1.00
1.45 (0.90-2.33) 2.91 (1.74-4.84) 2.18 (1.26-3.77) 1.88 (1.09-3.22)
1.00
3.17 (2.27-4.43) 3.09 (1.71-5.60)
<0.001
0.005
0.004
<0.001 0.013
0.097 0.002 0.943 <0.001
0.127 <0.001 0.006 0.023
<0.001
<0.001
<0.001 0.040
0.225
0.033
1.00
1.69 (1.04-2.72) 1.94 (0.86-4.34)
1.00
1.00 (0.55-1.82)
5.28 (2.04-13.60)
0.044
0.033
0.109 0.003
0.998
0.001
1.00
1.54 (1.09-2.18) 1.42 (0.87-2.32) 1.25 (0.81-1.91) 1.62 (1.11-2.38)
1.00
0.74 (0.61-0.91)
1.00
1.67 (1.23-2.27) 1.35 (0.71-2.59)
1.00
0.27 (0.15-0.47) 0.17 (0.02-1.31)
0.015
0.014 0.166 0.310 0.013
0.004
0.004
0.001
0.362 <0.001
<0.001
0.089
Max MTC symptoms pre-donation Grade 0
Grade 1
Grade 2-4
1.00
0.74 (0.46-1.20)
3.04 (1.10-8.42)
OR: odds ratio; CI: Confidence Interval; BMI: Body Mass Index; Max: maximum.
852
haematologica | 2019; 104(4)
