
Page 222 - 2019_04-Haematologica-web
P. 222
M.A. Pulsipher et al.
higher (OR 1.21; P=0.006). This increase in pain levels was not noted when analyzed by dose per/kg.
Females undergoing PBSC collection had twice the risk of moderate and severe pain and MTC symptoms (Table 3). They were also more likely to have persistent symp- toms and to fail to recover to pre-donation levels at one year after BM collection (Table 4). The age effect varied, with PBSC donors aged 30-39 years having higher risk for grade 3-4 pain with collection (OR 1.50; P=0.021) (Table 3) and older donors (aged 50-60 years) having lower risks for
grade 2-4 pain with collection (OR 0.61; P<0.00) (Table 3) and higher risks of reporting grade 2-4 pain at one year (aged 50-60 years: OR 2.72; P<0.001) (Table 4). Importantly, donors who started with grade 1 or 2-4 pain or grade 2-4 MTC symptoms were more likely to report higher grades of pain or symptoms with collection (P<0.001) (Table 3). These donors also had higher levels of pain and MTC symptoms at one year, but most of them had returned to pre-donation levels. Obesity was impor- tant in pain and MTC symptom risk, as donors with 30+
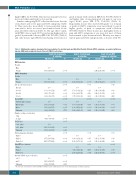
Table 3. Multivariate analysis showing other key predictors for skeletal pain and Modified Toxicity Criteria (MTC) symptoms associated with bone marrow (BM) and peripheral blood stem cell (PBSC) collections.
Grade 2-4 skeletal pain Grade 3-4 skeletal pain at collection at collection
Grade 2-4 max MTC symptoms at collection
Variable OR (95% CI) P OR (95% CI)
BM donation
Gender
Male 1.00
Female 1.67 (1.41-1.97) <0.001
PBSC donation
Gender
Male 1.00 1.00 Female 1.76 (1.60-1.93) <0.001 2.18 (1.69-2.81)
Age at collection (years) <0.001
18to29 1.00 1.00 30to39 1.00 (0.90-1.12) 0.977 1.50 (1.06-2.12) 40to49 0.85 (0.75-0.96) 0.008 1.19 (0.83-1.72) 50to60 0.61 (0.52-0.71) <0.001 0.77 (0.51-1.16)
Donor BMI <0.001
Underweight / normal 1.00 1.00 Overweight 1.13 (1.02-1.26) 0.021 1.30 (0.92-1.84) Obese 1.35 (1.18-1.55) <0.001 2.03 (1.47-2.82) Unknown 0.92 (0.52-1.63) 0.776 1.21 (0.48-3.05)
Number of days of collection
1 day 1.00
2+ days 0.74 (0.64-0.85) <0.001
G-CSF dose 0.007
0-960 g/day 1.00
>960 g/day 1.21 (1.06-1.38) 0.006 Unknown 1.37 (0.96-1.97) 0.086
Skeletal pain pre-donation <0.001
Grade 0 1.00 1.00 Grade 1 1.57 (1.36-1.82) <0.001 1.39 (0.95-2.02) Grade 2-4 2.47 (1.77-3.46) <0.001 2.33 (1.37-3.96)
Max MTC pre-donation
Grade 0 1.00 Grade 1 0.85 (0.54-1.34) Grade 2-4 2.67 (1.22-5.82)
Absolute CD34+ at pre-collection <0.001 <80.5 1.00
≥80.5 1.25 (1.14-1.37) <0.001
Unknown 1.14 (0.87-1.48) 0.341
P
<0.001 0.005
0.021 0.340 0.216 <0.001
0.137 <0.001 0.686
0.004
0.087 0.002 0.030
0.477
0.014
OR (95% CI)
1.00
2.74 (2.23-3.37)
1.00
1.91 (1.65-2.20)
1.00
1.18 (0.98-1.41) 1.26 (1.05-1.53) 0.91 (0.72-1.16)
1.00
1.31 (1.10-1.57) 1.63 (1.36-1.96) 1.11 (0.50-2.45)
1.00
1.31 (1.05-1.64) 1.65 (1.08-2.52)
1.00
1.37 (1.06-1.77) 3.23 (1.86-5.61)
P
<0.001
<0.001 0.013
0.080 0.015 0.452 <0.001
0.003 <0.001 0.806
0.006
0.016
0.020
<0.001
0.017
<0.001
OR: odds ratio; CI: Confidence Interval; BMI: Body Mass Index; G-CSF: granulocyte-colony stimulating factor; Max: maximum.
850
haematologica | 2019; 104(4)
