
Page 180 - 2019_02-Haematologica-web
P. 180
E. Maffini et al.
ed serum and urine SPEP and IFIX for M-protein detection and quantification, plasma cell quantification, cytogenetics and FISH studies in the marrow, and radiological imaging to assess for oste- olytic lesions/plasmacytomas whenever appropriate. Six-color multi-parameter flow cytometry analysis of marrow cells for detection of minimal residual disease (MRD) was carried out for a subset of patients who achieved IFIX-negative CR after tandem autologous-allogeneic HCT and were treated at Fred Hutch (n=28). Samples were analyzed at the University of Washington Hematopathology Laboratory. The sensitivity of the flow cytom- etry assay for plasma cell neoplasms ranged from 0.01 to 0.001%. MRD negativity (MRDNEG) status was defined as no evidence of quantifiably detectable disease.
Graft-versus-host disease evaluation
Grading of acute and chronic GvHD was performed according
to previously described methods.33,34 Information regarding the administration of systemic immunosuppressive treatment for GvHD was collected prospectively.
End points and statistical methods
Primary objectives of this study were OS and PFS. Secondary end points included: cumulative incidences of acute GvHD, chron- ic GvHD, NRM, disease response, and disease relapse. We also examined response to treatment and survival among those patients who experienced disease relapse after allogeneic HCT. OS, PFS, and NRM were defined as the times from allogeneic HCT to death, death or progression, and death without progres-
sion, respectively. Probabilities of OS and PFS were estimated using the Kaplan-Meier method; cumulative incidences of relapse, NRM, and GvHD were estimated taking competing risks into account. Cox and Fine & Gray regression models were used to
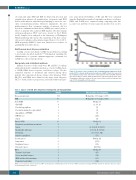
Figure 1. Prevalence curve of patients alive requiring immunosuppressive treat- ments (IST) for chronic graft-versus-host-disease (GvHD). Black line represents the standard survival curve (OS) for the entire patient cohort (n=244). Patients alive and on IST for chronic GvHD treatment are represented by the blue curve. The graphical difference between the two curves is the fraction of patients alive and off IST, during different time points.
Table 3. Causes of death after allogeneic hematopoietic cell transplantation. Events Number
Disease progression 104
NRM 40 Acute GvHD 10 Gut GvHD 4 Cerebral aspergillosis 1 Cerebral ischemia r/to septic emboli 1 Aspergillosis + TTP/HUS 1 CMV disease 2 Sepsis 1 Chronic GvHD 20 Respiratory syncytial virus pneumonia 1 Sepsis 7 Bronchiolitis obliterans 6 Pneumonia 5 Invasive aspergillosis 1 Second cancers 5 Lung cancer 2 Esophageal cancer 1 Pancreatic cancer 2 Other 5 Traumatic head injury 1 Severe grand mal seizures 1 ARDS and alveolar hemorrhage 2 Congestive heart failure 1
Time (months) after allografting
Median time: 36.6 (range: 1–179)
Median time: 10.9 (range: 2–183) Median: 3.5
(3,3,3,4)
(5)
(3)
(6)
(2, 4)
(5)
Median: 12
(7)
(6, 8, 18, 23, 11, 58, 15)
(9, 10, 14, 16, 37, 112)
(7, 7, 11, 13, 142)
(11)
Median: 121
(4, 13)
(130)
(121, 182)
Median: 45
(45)
(64)
(3, 3)
(136)
ARDS: acute respiratory distress syndrome; CMV: cytomegalovirus; GvHD: graft-versus-host disease; NRM: non-relapse mortality; TTP/HUS: thrombotic thrombocytopenic purpu- ra and hemolytic-uremic syndrome.
384
haematologica | 2019; 104(2)
