
Page 178 - 2019_02-Haematologica-web
P. 178
E. Maffini et al.
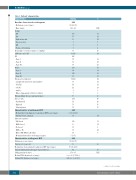
Table 1. Patients’ characteristics. Characteristics
Baseline characteristics at diagnosis
Median age, years (range)
Male: female
Isotype
Total (n) %
244
51 (25–67) 143–101
59/41
IgG 151 62 IgA 51 22 Light chains only 30 12 Non-secretory 3 1 IgD 31
Plasma cell leukemia
Renal failure (serum creatinine > 2 mg/dL)
LDH values ≥ 2 ULN
ISS 225
StageI StageII Stage III
72 32 96 43 57 25
6 2 39 18 60/216 28
R-ISS 217 89
38 18 143 66 36 16 97/232 42 31 32 del(17p) 28 29
StageI Stage II Stage III
Cytogenetics, high-risk
≥ 2 high-risk cytogenetic abnormalities
t(4;14)
amp1q
Others [hypoploidy; t (14;16); t (14;20)]
Extramedullary disease (plasmacytomas) Disease risk
Standard risk High risk Ultra-high risk
Characteristics at autologous HCT
Median time from diagnosis to autologous HCT, years (range)
Failed previous autograft Induction regimens
22 23 9 9 7 7 50 20 214 88 62 28 73 35 79 37
244
0.8 (0.2–18.1)
35 14
VAD-based 125 51 IMiDs-based 30 12 PIs-based 15 6
IMiDs + PIs
Other (MP; HD-Dex; Dex-Cy)
Median induction lines of therapy, n (range)
Characteristics at allogeneic HCT
Median age, years (range)
Patients > 60 years old
Median time from autograft to allogeneic HCT, days (range) Patients with induction therapy-refractory disease
Sibling, unrelated donor
Median CD34+/kg infused, n (range)
Median CD3+/kg infused, n (range)
56 24
18 7 1 (1–5)
244
53 (25–71)
50 20
75 (40–281)
42 17
179 – 65
9.00 x 10⁶ (1.7–24.0) 3.28 x 10⁸ (0.4–11.7)
73/27
continued on the next page
382
haematologica | 2019; 104(2)
