
Page 112 - 2019_02-Haematologica-web
P. 112
A.L. Fedullo et al.
Discussion
The management of adults with Ph+ ALL currently relies on the use of first,8-10,13-16 second11,12 and third37 gener- ation tyrosine kinase inhibitors, either alone9-12 or in com- bination with chemotherapy,8,13-16,37 followed - if feasible and necessary - by HSCT. These approaches have greatly improved the outcome of Ph+ ALL: nowadays, virtually all patients - independent of age - achieve a complete hematologic remission, coupled to a CMR in a variable proportion of cases. Nonetheless, in all reported studies the long-term outcome is in the range of 50% at 5 years; thus, additional prognosticators capable of better stratify-
Table 3. Summary of univariate and multivariate analyses for complete molecular response and disease-free survival for the factors identified.
account white blood cell count, age, tyrosine kinase inhibitor use and the genomic lesions described above, the only factor that retained statistical significance was ΔKRAS (P=0.01); a trend was noted for ΔMEF2C-long deletions (P=0.075) (Table 3).
In multivariate analysis for DFS, considering ΔMEF2C- long, ΔIKZF1+CDKN2A and/or PAX5, white blood cell count and CMR as variables, the factors that had a nega- tive impact were ΔMEF2C-long (P=0.057) and white blood cell count (P=0.05), while a trend towards a worse DFS was observed for ΔIKZF1+CDKN2A and/or PAX5 (P=0.089) (Table 3). HSCT did not affect the prognostic role of the above-mentioned lesions.
MEF2C deletions KRAS deletions
White blood cell count Age
Imatinib vs. dasatinib Fusion protein
(p190 vs. p210 and p190/210) ΔIKZF1+ CDKN2A and/or PAX5
White blood cell count
Age
CMR
Fusion protein
(p190 vs. p210 and p190/210)
Imatinib vs. dasatinib
Allogeneic transplant
Univariate analysis for CMR OR (95% CI)
0.288 (0.082, 1007)
0.12 (0.024, 0.601) 0.986 (0.969, 1.003) 1.026 (0.99, 1.063) 0.267 (0.057, 1.248)
1.247 (0.421, 3.693) 1.600 (0.599, 4.581)
Univariate analysis for DFS HR (95% CI)
0.359 (0.144, 0.891)
1.834 (1.148, 2.929) 1.002 (1, 1.004) 1.001 (0.986, 1.017) 0.423 (0.181-0.987)
0.939 (0.582, 1.515)
1.305 (0.807, 2.109)
0.682 (0.362, 1.284)
P value 0.051
0.009 0.1 0.16 0.093
0.691 0.381
P value 0.027
0.011 0.065 0.866 0.046
0.797
0.277
0.23
Multivariate analysis for CMR OR (95%CI)
0.259 (0.058, 1.146)
0.068 (0.009, 0.529) 0.986 (0.966, 1.007) 1.028 (0.985, 1.072) 0.296 (0.054, 1.615)
Multivariate analysis for DFS HR (95%CI)
0.417 (0.169-1.028)
1.608 (0.930, 2.781) 1.003 (1, 1.006) 1.01 (0.995-1.028) 0.402 (0.167-0.969)
P value 0.075
0.01 0.188 0.205 0.159
P value 0.057
0.089 0.050 0.180 0.042
MEF2C deletions
ΔIKZF1+ CDKN2A and/or PAX5
CMR: complete molecular response; OR: odds ratio; 95% CI: 95% confidence interval; DFS: disease-free survival; HR: hazard ratio.
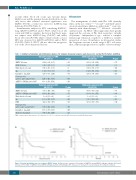
AB
Figure 4. Survival probability curves according to MEF2C status. (A) Disease-free survival at 36 months of ΔMEF2C versus MEF2C wild-type patients. (B) Overall survival at 36 months of ΔMEF2C versus MEF2C wild-type patients. WT: wild-type; DFS: disease-free survival; OS: overall survival; CR: complete remission.
316
haematologica | 2019; 104(2)
