
Page 98 - 2019_01-Haematologica-web
P. 98
M. Spagnuolo et al.
gets is modulated by miR-17-92 overexpression, qRT-PCR experiments were performed in Doxy-treated BV173- ShMYB-EV cells and in the miR-17-92 over-expressing line. After 24 h Doxy treatment, levels of BIM and PTEN mRNA were essentially identical in both BV173-ShMYB-
EV and BV173-ShMYB-miR-17-92 over-expressing cells compared to those in NT cells (Figure 4D). In contrast, THBS1 mRNA levels showed an increase (P≤0.05) in Doxy-treated BV173-ShMYB-EV cells compared to untreated cells, and such an increase was blocked by over-
A
BC
DE
F
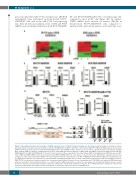
Figure 4. Transcriptional analysis and evaluation of mRNA expression levels of miR-17-92 cluster target genes. (A) Unsupervised hierarchical clustering of common deregulated genes from gene expression analysis of parental and MYB-silenced BV173 and K562 cells. (B and C) qRT-PCR of PBX2 and FRZB expression levels upon MYB knockdown [24 hours (h)] of the indicated Philadelphia-positive (Ph+) ShMYB cell lines. Results are mean of three experiments. Error bars indicate Standard Error of Mean (SEM). (D) Analysis of mRNA expression levels, using SYBR Green-based qRT-PCR, of BIM, PTEN and THBS1 in untreated and Doxy-treated BV173- ShMYB-Empty Vector (EV) and ShMYB-miR-17-92 cells. Results are mean of three experiments. Error bars indicate SEM. (E) Quantification by SYBR Green-based qRT- PCR of PBX2 and FRZB mRNA in untreated and Doxy-treated BV173-ShMYB-miR-17-92 cells. Values are reported as 2-ΔCt. GAPDH gene expression was used as endogenous control. Error bars indicate SEM (n=3). (F) (Left panel) Schematic representation of 3’UTRs of FRZB gene with putative binding sites for miR-17-92 clus- ter. (Right panel) Schematic representation of reporter plasmids containing the wild-type (wt) or mutant (76-81 mut, 1091-1097 mut of miR-17-92-binding sequences) FRZB 3’UTR. Dual Luciferase assay in recipient cells co-transfected with luciferase reporter vectors containing the wt-3’UTR FRZB or the indicated FRZB mutant and either the hsa-miR-17, the hsa-miR-19a mimics or a control (Ctr)-mimic RNA. Firefly luciferase activity of each sample was normalized by Renilla luciferase activity. Results are expressed as fold activation relative to the basal activity of the control mimic (ctr-mimic). (*P≤0.05). The normalized luciferase activity, set as mean of at least three independent experiments performed in duplicate, is shown. Error bars represent the mean±SEM (n=3).
88
haematologica | 2019; 104(1)
