
Page 72 - 2019_01-Haematologica-web
P. 72
J. Stomper et al.
A
B
C
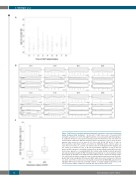
Figure 1. HbF kinetics in patients with myelodysplastic syndrome/acute myeloid leukemia during treatment with decitabine. (A) Box plot of HbF values prior to treatment with decitabine and after each of the first eight treatment courses in patients with myelodysplas- tic syndrome (n=15) or acute myeloid leukemia (n=25) for whom there was more than one measurement of HbF level. HbF was measured prior to treatment (= cycle 0) in 39 of these patients, after courses 1 to 8 (= cycles 1, 2, 3, etc.) in 38, 32, 24, 18, 14, 10, 7, and 9 of these patients, respectively. Outliers are plotted as individual points, extreme values as stars. For each of cycles 0, 1, and 3, one extreme value is not displayed in the diagram, and one outlier is not shown for cycle 2. (B) Two representative vignettes of each of the four groups of HbF responses to decitabine treatment are shown: initially normal HbF induced to levels above (group A) or remaining within the normal range during treatment (group B); already elevated pre-treatment HbF remaining elevated (group C) or decreasing to normal levels (group D). Shaded areas within the charts indicate values outside the normal range. The end of each decitabine treatment course is indicated with a numbered arrow. Hb: hemo- globin; HbF: fetal hemoglobin; PLT: platelets; WBC: white blood cells. (C) Box plot of HbF val- ues at the end of the second course of decitabine treatment in 32 MDS/AML patients show- ing higher HbF levels in patients achieving complete or partial remission (CR, PR) as best overall response (right) compared to patients who did not attain CR/PR (left).
62
haematologica | 2019; 104(1)
