
Page 71 - 2019_01-Haematologica-web
P. 71
HbF induction in AML/MDS and outcome prediction
By grouping patients according to pre-treatment HbF levels (normal versus elevated) and subsequent HbF levels (normal versus increased), four different patterns could be discerned. In patients with normal pre-treatment HbF, HbF was either induced to levels above the upper limit of normal (group A, n=11) or remained within the normal range (group B, n=12); among patients with elevated pre- treatment levels, HbF either remained elevated also in sub- sequent measurements (group C, n=13, in most cases after an initial drop following the first treatment course) or dropped to normal levels, without subsequent elevation above the upper limit of normal (group D, n=3). Two vignettes representative of each of the four different pat- terns of HbF kinetics are shown in Figure 1B. The number of treatment courses varied between these four groups: median numbers were 5, 2, 7 and 3 courses in groups A, B, C and D, respectively (range: 2-11, 2-6, 2-23, and 2-6 courses, respectively). Consequently, more patients in groups A and C attained hematologic responses over time, including complete remission (with suppression of the abnormal clone in patients with initial cytogenetic abnor- malities), compared to patients in groups B and D. HbF levels were elevated in significantly more patients during treatment (groups A+C: n=24, 61.5%) than prior to treat- ment (groups C+D: n=16, 41.0%; P=0.033).
Early HbF induction by decitabine has predictive value for subsequent hematologic stabilization and response Among patients achieving complete or partial remission
as their best overall response, a median HbF of 1.9% (1.9% in MDS, 2.0% in AML) was observed at this time point compared to a median of 0.8% (1.0% and 0.6%, respectively) in patients not attaining complete or partial remission (P=0.015) (Figure 1C, Online Supplementary Figure S2).
Given that robust HbF induction during decitabine treatment was first observed after two cycles of treatment, we chose this time point for further analyses regarding the potential value of HbF induction for predicting subsequent responses. Using linear regression models and correlation analyses, we assessed the association between HbF levels after course 2 of decitabine treatment and responses in the different hematopoietic lineages after course 4 in all 40 MDS/AML patients (3 patients did not receive more than 2 courses, but had peripheral blood counts available 3 months after course 2: one underwent hematopoietic stem cell transplantation, one changed to a different study after course 2, and one received thalidomide and best sup- portive care at that point).
Higher HbF levels after two courses were associated with significantly higher platelet counts after four courses (rs=0.49, P=0.01) (Figure 2A). As for neutrophil counts, a trend towards higher counts after course 4 in patients with elevated HbF levels after course 2 was noted (rs=0.35, P=0.08) (Figure 2B). A borderline significant association was also observed between HbF levels after two courses of treatment and hemoglobin levels after four courses (rs=0.36, P=0.08) (Figure 2C). Interrogating the potential prognostic value of HbF induction for bone marrow blast suppression after four courses in the entire cohort of 21 MDS/AML patients with available blast counts, an association was noted (rs=-0.48, P=0.03) (Figure 2D). When looking at MDS and AML patients separately, the overall results were simi- lar in both cohorts, particularly for blast suppression (Online Supplementary Figure S4A-D). Moreover, similar results were
observed when restricting the same kind of analysis to MDS and AML patients who had received more than four courses of decitabine (data not shown).
In patients achieving platelet doubling already after one course of decitabine, the median HbF after course 2 was 1.9%, versus 0.8% in patients without this platelet response (P=0.006) (Figure 2E). In contrast, no correlation was observed between HbF levels and platelet counts before treatment initiation: rs=-0.13 (P=0.63) in MDS (n=16) and rs=0.02 (P=0.91) in AML patients (n=36).
Association of HbF induction by decitabine and survival outcomes in patients with myelodysplastic syndrome/acute myeloid leukemia
Overall, progression-free and AML-free survival were measured from the time of HbF determination after com- pletion of two courses of decitabine treatment. In the MDS cohort, overall survival was significantly longer in the nine patients in whom HbF was elevated above the upper limit of normal at that time point than in the six patients with HbF in the normal range: median 22.9 versus 7.3 months, respectively (HR=0.21; 95% CI: 0.05-0.87; P=0.03) (Figure 3A). Censoring the six patients who had
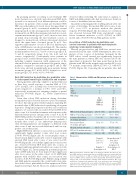
Table 1. Characteristics of MDS and AML patients and their disease at baseline.
Age (years; median and range)
Sex Male Female
FAB subtype
WBC (x 109/L; median and range)
ANC (x 109/L; median and range)
Peripheral blood blasts
(%; median and range)
Bone marrow blasts (%; median and range)
Hb (g/dL; median and range) PLT (x 109/L; median and range) sLDH (U/l; median and range)
Cytogenetics
MDS
74 (66 - 77)
8
7
RA: 1 RAEB: 8 RAEB-t: 4 CMMoL: 2
2.4 (0.8 - 18.8) 0.93 (0.16 - 2.40) 1 (0 - 13)
18 (2 - 30)
8.4 (5.0 - 11.3) 35 (10 - 151) 235 (102 - 842)
Normal: 3 Sole 5q-: 1 Sole -7: 1
Complex: 6
No metaphases: 4
AML
73 (62 - 82)
15
10
M1: 4 M2: 2 M4: 5 M5: 1 M6: 3 N/A: 10
2.2 (0.5 - 27.1) 0.33 (0 - 14.09) 19 (0 - 96)
55 (10 - 95)
8.7 (5.6 - 12.4) 34 (7 - 229) 271 (134 - 1276)
Intermediate risk: 7 Poor risk: 6
< 10 normal metaphases: 4 No metaphases: 1 N/A: 7
MDS: myelodysplastic syndrome; AML: acute myeloid leukemia. RA, refractory ane- mia; RAEB: refractory anemia with blast excess; RAEB-t: refractory anemia with blast excess in transformation (i.e.AML according to the World Health Organization classi- fication); CMMoL: chronic myelomonocytic leukemia. FAB (French-American-British) subtypes: M1: acute myeloblastic leukemia with minimal maturation; M2: acute myeloblastic leukemia with maturation; M4: acute myelomonocytic leukemia; M5: acute monocytic leukemia; M6: acute erythroid leukemia. N/A: not assessed; WBC: white blood cells; ANC: absolute neutrophil counts; Hb: hemoglobin; PLT: platelets; sLDH: serum lactate dehydrogenase.
haematologica | 2019; 104(1)
61
