
Page 192 - 2019_01-Haematologica-web
P. 192
C. Tromeur et al.
100%.70 The very high negative predictive values need to be interpreted on the background of the very low preva- lence of PE, which varied between 1% and 7% in the studies evaluated, implying a very low post-test probabil- ity of PE even with less than optimal sensitivity of a diag- nostic test.71 Only if current active trials confirm the safety of using the clinical decision rule and a D-dimer test to select patients with a higher pre-test probability of PE, could the diagnostic safety of CTPA and VQ-lung scan- ning be better tested and compared.3,72 Notably, increasing the level of suspicion of PE with a specific strategy during pregnancy may lead to a lower negative predictive value of both CTPA and V-Q lung scanning.
It has been widely acknowledged that, in contrast to CTPA, the risk of a non-diagnostic test result with V-Q lung scanning is considerable. Importantly, we found that the pooled risks of a non-diagnostic test for both imaging tests in the setting of pregnant patients with suspected PE were comparable. These pooled risks need to be put in perspective. For CTPA, a non-conclusive result was defined as suboptimal contrast opacification and respira- tory motion artifacts that did not allow for a certain inclu- sion or exclusion of PE. For V-Q lung scanning, we defined non-diagnostic or inconclusive results according to the PIOPED criteria as intermediate and low probabil- ity scan results.73 We found considerably higher rates of non-diagnostic results with CTPA and V-Q lung scanning than those reported in a recent Cochrane review.70
Notably, the definition of non-diagnostic tests was not provided in the Cochrane review and, based on our results, was probably underestimated. Indeed, most of the retrospective studies included in the Cochrane review used intermediate probability V-Q lung scan results as the definition of non-diagnostic results and low probability scans as normal scans whereas we classified low and intermediate probability scan results as non-conclusive. Importantly, clinical probability assessed by clinical judgement or a validated prediction rule is essential for the correct interpretation of a V-Q lung scan: a non-diag- nostic V-Q lung scan may exclude PE when combined with negative proximal compression ultrasound sonogra- phy in patients with a low clinical probability of PE.73 Compression ultrasound sonography may also be helpful when combined with an intermediate V-Q lung scan probability to confirm or rule out acute PE. Unfortunately, such information was not provided by the studies identified. Therefore, the rate of non-diagnostic V-Q lung scans in our analysis may be biased towards overestimation. Again, the lack of direct comparisons and studies evaluating state-of-the art imaging protocols does not allow for definite conclusions. Of note, we cannot rule out the potential bias that while standard V-Q scan reporting involves a statement on non-diagnostic results, this is not the case for CTPA.
It is generally known that CTPA results in relatively higher maternal radiation exposure but lower fetal
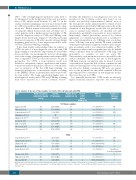
Table 2. Analysis of the rate of false negative test results after V-Q lung scans and CTPA.
Study
Balan et al. 1997
Chan et al. 2002 Scarsbook et al. 2007* Ezwawah et al. 2008 Shahir et al. 2010** Revelet al. 2011
Cutts et al. 2014 Sheen et al. 2017 Golfam et al. 2017
Scarsbook et al. 2007 Litmanovitch et al. 2009 Shahir et al. 2010
Revel et al. 2011 Bourjeily et al. 2012
Browne et al. 2014
Nijkeuter et al. 2013
Sheen et al.2017
Number of patients subjected to imaging test (n)
82
113 96 19 99 91 183 225 362
9
26 106 43 343
70
143
97
Baseline PE prevalence
22% (18/82)
7.1% (8/113) 1.0% (1/96) NP
1% (1/99) 11% (10/91) 2.2% (4/183) 2.7% (6/225) 4.7% (17/363)
22.2% (2/9)
0% (0/26) 3.7% (4/106) 16% (7/43) 2.6% (9/343)
1.4% (1/70)
4.2% (6/143)
4.1% (4/97)
Number of true Number negative test (n) of VTE during
follow-up (n)
V-Q lung scanning
31 0
83 0 89 0 19 0 77 0 64 0 173 0 198 0 316 0
CTPA
6 0
26 0 95 1 28 0 335 0
69 0
129 0
84 2
NPV (%), 95% CI
100, (88.97-100)
100, (95.58-100) 100, (95.86-100) 100, (83.18-100) 100, (95.25-100) 100, (94.34-100) 100, (97.83-100) 100 (98.10-100) 100 (98.95-100)
100, (60.97-100)
100, (87.13-100) 98.96, (94.33-99.82) 100, (87.94-100) 100, (98.86-100)
100, (94.73-100)
100, (97.11-100) 97.94, (99.43-92.79)
Duration of follow-up (months)
NP
6 24.5 3 3 3 NP 3 3
24.5
18
3
3
3 months or
6 weeks postpartum 6
3
3
PE: pulmonary embolism;VTE: venous tromboembolism; NPV: negative predictive value; CI: confidence intervals; NP: not provided;V-Q scanning: ventilation perfusion scanning. CTPA: computed tomography pulmonary angiography; *one PE was diagnosed after 3 months of follow-up. **very low PE probability V-Q lung scans are considered as normal V-Q lung scans.
182
haematologica | 2019; 104(1)
