
Page 151 - 2019_01-Haematologica-web
P. 151
RiBVD regimen as first-line treatment for older MCL patients
and 59 (80%) received all six planned cycles (Figure 1). Of the planned 444 cycles, 406 (91.5%) were administered. Fifteen patients stopped therapy before receiving all six cycles (Figure 1). After four cycles, the overall response rate was 86.5% (64/74) and the complete response rate (confirmed and unconfirmed complete responses) was 56.5% (42/74). At the end of treatment, the overall response rate was 84% (62/74) and the complete response rate was 75.5% (56/74). FDG-PET evaluations were per- formed after four cycles of treatment in 64 patients (100% of the 64 responders) and after cycle 6 in 59 patients (95% of the 62 responders). Interim and final FDG-PET were negative in 64% (41/64) and in 78% of evaluated patients (46/59), respectively.
Molecular minimal residual disease in blood and bone marrow
Molecular MRD was assessed in a total of 58 of the 74 patients eligible for MRD analysis (in all, 732 samples were assessed, see Online Supplementary Figure S1). Molecular MRD analysis was not possible in 16 of 74 MRD-eligible patients because of a lack of MRD target (n=6), missing follow-up samples (n=9) or because an MRD target reference sample was not available (n=1) (Online Supplementary Figure S1). After four cycles (mid- term), 57 patients were analyzed for molecular MRD (57 peripheral blood samples; 48 bone marrow samples, of which 48 patients with paired bone marrow and peripher- al blood MRD samples, at the mid-term analysis). Of these, 50 patients were negative for molecular MRD (32 in complete remission, 18 in partial remission) and seven were positive (2 in complete remission, 4 in partial remis- sion and 1 with stable disease) in the blood and/or bone marrow, for a molecular response rate of 79% (defined by a quantitative polymerase chain reaction assay with a sen- sitivity of 10-5). After six cycles of treatment, 54 patients were analyzed for molecular MRD (54 peripheral blood samples; 46 bone marrow samples, of which 46 patients with paired bone marrow and peripheral blood samples for MRD analysis at the end of treatment). Of these 54 patients, 41 were MRD-negative (39 in complete remis-
sion, 1 in partial remission and 1 with stable disease) and 13 were MRD-positive (8 in complete remission, 4 in par- tial remission and 1 with progressive disease) in blood and/or bone marrow (76% molecular response rate) (Figure 2 and Online Supplementary Figure S1).
Molecular MRD response rates were then analyzed sep- arately in the peripheral blood versus bone marrow at the mid-term follow-up time-point (after 4 treatment cycles) and at the end of treatment (after 6 cycles). Blood samples were molecular MRD-negative from 88% (50/57) of patients after four cycles and 87% (47/54 patients) after six cycles (Figure 2C, left panel). The corresponding per- centages for bone marrow samples were 77% (37/48 patients) after four cycles of treatment and 76% (35/46 patients) at the end of treatment (after 6 cycles) (Online Supplementary Figure S3).
Survival analyses and prognostic factors
With a median follow-up time of 52 months, 74 patients were evaluable. Overall, 24 patients died, four during treatment (2 from cardiac arrest, 1 with pneumonia and 1 with progressive multifocal leukoencephalopathy, after cycle 3) and 20 during follow-up (16 due to progressive disease, 1 from pancreatic adenocarcinoma, 1 from cardiac arrest and 2 from unknown causes).
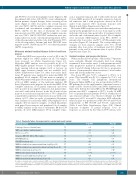
The 2-year PFS was 70.3% compared to 57.6% at 4 years. The 2-year OS was 81.1% compared to 71.3% at 4 years. The Mantle Cell Lymphoma International Prognostic Index (MIPI) score was not predictive for PFS or OS perhaps due to the small number of patients because a trend could be observed (Table 2 and Online Supplementary Figure S2A). Indeed, the 4-year OS for the 58 MIPI high-risk patients was 66.8% compared to 85.7% for the 14 MIPI low- or intermediate-risk patients (P=0.13). Neither histol- ogy (classical subtype versus blastoid subtype) nor Ki67 expression (<30% versus ≥30% of positive MCL cells in the tumor biopsy) was predictive for OS (P=0.10 and P=0.24, respectively) or PFS (P=0.08 and P=0.13, respectively) (Table 2 and Online Supplementary Figure S2B). Clinical responses (complete or partial response versus no response), as assessed by the Cheson 1999 criteria, were
Table 2. Prognostic factors for progression-free survival and overall survival. Prognostic factors N.
Pathology (classic vs. blastoid form) 71 MIPI score (high vs. low/Intermediate) 72 Ki67 (< vs. ≥ 30%) 51 Response IWC 1999 (CR vs. PR vs. failure) 74 FDG-PET midterm 64 FDG-PET treatment end. 59 MRD blood and/or bone marrow at mid-term (neg 45; pos 12) 57 MRD blood and/or bone marrow at treatment end (neg 41; pos 13) 54 MRD blood mid-term (neg 50; pos 7) 57 MRD blood treatment end (neg 47; pos 7) 54 MRD bone marrow midterm (neg 37; pos 11) 48 MRD bone marrow treatment end (neg 35; pos 11) 46
P for PFS 0.08
0.18
0.35 <0.0001 0.19 0.48 0.20 0.04 0.01 <0.0001 0.24 0.20
P for OS 0.10
0.13
0.24 <0.0001 0.57 0.98 0.33 0.02 0.047 <0.0001 0.41 0.19
N: number of patients who could be evaluated ; MIPI score,: Mantle-Cell Lymphoma International Prognosis Index; Ki67/Mib1, proliferation index score; Response IWC 1999, response according to the 1999 International Workshop Criteria; PF: progression free survival; OS: overall survival (at 4 years), respectively; CR: complete response; PR: partial response; FDG-PET, [18F]fluorodeoxyglucose positron emission tomography; mid-term, analysis after four cycles; treatment end, analysis after six cycles; MRD, (molecular) min- imal residual disease.
haematologica | 2019; 104(1)
141
