
Page 69 - 2018_12-Haematologica-web
P. 69
ZPP/H for iron deficiency anemia diagnosis
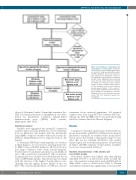
Non anemic group Children n=173 Women n=99
Non anemic group Children n=100 Women n=90
Figure 1. Flow diagram of participants and categorization of study groups. Schematic representation of the study design and sam- ple selection. Using age and gender-adjust- ed WHO definitions for Hb and serum fer- ritin, samples were divided into a non-ane- mic group and a group with iron deficiency anemia. Those individuals with normal Hb values but low serum ferritin were defined as having iron deficiency and excluded. Using a computer random number genera- tor, 200 samples from the iron deficiency anemia group (children = 100; women = 100) and 190 samples from the non-anemic group (Children = 100; Women = 90) were randomly selected for biomarker measure- ments. IDA: iron deficiency anemia; Hb: hemoglobin.
(Access 2, Beckman Coulter). Serum high sensitivity (hs)- CRP, a biochemical measure of inflammation, was deter- mined by quantitative sandwich enzyme-linked immunosorbent assay ([ELISA] R&D systems, Minneapolis, MN, USA).
Statistical analysis
Variables were aggregated into mean±SD (continuous variables with a Gaussian distribution, t-test for departure from no difference) and median with the interquartile range ([IQR] continuous variables with non-Gaussian dis- tribution, Mann-Whitney test for departure from no dif- ference).
To determine ZPP/H and serum hepcidin cut-off values for IDA diagnosis, we used receiver operating characteris- tic (ROC) curves with IDA defined as Hb below the nor- mal range combined with serum ferritin<12ng/mL. Youden index (J=sensitivity+specificity-1) and likelihood ratios [LR+=sensitivity/(1-specificity)] [LR-=(1-sensitivi- ty)/specificity] were calculated for each individual cut-off value of ZPP/H and hepcidin. This iterative process began with the selection of the highest Youden indices corre- sponding with the highest positive likelihood ratio for IDA.14 The conventional threshold of <0.05 was used for
statements about statistical significance. All statistical analyses were done using SPSS 16.0 software (SPSS Inc., Chicago, IL, USA) and ROC curves were performed using MedCalc software (MedCalc, Ostend, Belgium).
Results
Comparison of baseline characteristics between the two groups (non-anemic and IDA) for children and women are presented as mean±SD for variables with a normal distri- bution and as the median ± interquartile range for vari- ables that are not normally distributed. Age, gender, hematological and biochemical parameters are presented in Table 1 and ROC estimates, Youden indices, and likeli- hood ratios are presented in Table 2.
Baseline characteristics of the anemic and non-anemic groups
Non-anemic children were slightly older than children with IDA (3.7±0.9 vs. 2.4±0.8 years) (Table 1) while the ages of non-anemic women and women with IDA did not differ (26±3.7 years vs. 25±3.8 years) (Table 1). Women and children with IDA had significantly lower mean Hb
haematologica | 2018; 103(12)
1993
