
Page 68 - 2018_12-Haematologica-web
P. 68
G. Kanuri et al.
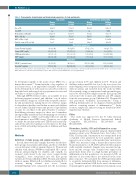
Table 1. Demographic, hematological and biochemical parameters of study participants. Non-anemic
Iron deficiency anemia (IDA)
Age ± SD
Sex M:F
Hemoglobin ± SD(g/dl) MCV ± SD (fL)
WBC ± SD x 103/mL
Platelet count ± SD x 105/mL
Serum Ferritin*(ng/mL)
Serum sTfR* (mg/L) sTfR/logferritin index CRP* (mg/L)
ZPP/H* ( mol/mol heme)
Hepcidin* (ng/mL)
Women (n=90)
26±3.7
na 13.2±0.7 86±4.5 8.7±2.0 3±0.7
39 (33, 48)
1.3(1.1, 1.5) 0.8 (0.7, 0.9) 1.4 (0.4, 3.4)
66 (53, 83)
17.7 (9, 38)
Children (n=100)
3.7±0.9
49:51 11.9±0.6 77±3.7 9.8±2.4 3.9±1
Women (n=100)
25±3.8
na 10±1.2a 74±7.6a 7.8±2.0 3.4±0.7
Children n=100)
2.4±0.8a
56:44 9.6±0.8a 65±5.9a 10.3±2.8 4.6±1.2
3.8a (2.6, 5.1)
3.9a (3, 5.1) 6.9a (4.5, 11.2) 0.5a (0.06, 1.6)
151a (104, 263)
1.2a (0.5, 3.6)
35 (32, 45)
1.7 (1.5, 2.0) 1.1 (0.9, 1.2) 1.1 (0.4, 2.2) Biomarkers
49 (39, 60)
42.6 (25, 62)
3.7a (2.9, 5.3)
3a (2.2, 4.0) 5.1a (3.5, 8) 0.6a (0.1, 2)
155a (101, 243)
0.6a (0.2, 1.3)
Biochemical parameters
*Data represented as median (inter quartile range). aP<0.05 compared with the appropriate non-anemic control group. SD: standard deviation; MCV: mean corpuscular volume; WBC: white blood cells; Stfr: serum transferrin receptor; CRP: C-reactive protein; ZPP/H: zinc protoporphyrin/heme.
be determined rapidly at the point-of-care (POC) by a hematofluorometer.5,6 Serum hepcidin, a key regulator of iron homeostasis, is an important biomarker because its levels determine how well oral iron is absorbed, with low hepcidin levels indicating both a requirement for iron and an ability to utilize it if provided.7,8
Although ZPP/H reference values are available for iron deficient pregnant women5 and children,6 cut-off values that establish a diagnosis of IDA with acceptable sensitiv- ity and specificity are lacking. Moreover, reference ranges for hepcidin in healthy rural Indian women and children are not defined. Indian women and preschool age children account for one-third of the global burden of anemia.3,9 Establishing reference ranges for these two biomarkers among healthy individuals and determining cut-off values for the diagnosis of IDA could facilitate their use and the development of novel POC assays. Therefore, we sought to define the median erythrocyte ZPP/H and serum hep- cidin levels and select optimal cut-off values for the diag- nosis of IDA in healthy rural preschool children and their mothers.
Methods
Definition of study groups and sample selection
In total, there were 2227 samples that were divided into three groups (non-anemic individuals, and those with IDA or iron deficiency without anemia) (Figure 1). Women and children with anemia (WHO recommended Hb concen- trations anemia<11g/dL for children and <12g/dL for women2) with absent body iron stores (serum ferritin <12ng/mL4), were categorized into the IDA group (women n=334 and children n=560). Women and children without anemia (Hb≥11g/dL for children and ≥12g/dL for women) having normal iron stores (serum ferritin≥30ng/mL) were categorized into the non-anemic
group (women n=99 and children n=173). Women and children with normal Hb but low body iron stores (fer- ritin<30ng/mL) were categorized as having iron deficiency without anemia and excluded from the study (n=1061). Subsequently, using a computerized random number gen- erator we selected 200 samples from the IDA group (100 each from both women and children) and 190 samples from the non-anemic group (Children=100; Women=90) and performed biomarker measurements.10 Using a sTfR/log ferritin index >2, we diagnosed nutritional IDA without coexisting anemia of inflammation.11,12 Study location, sample size, and processing are detailed in Online Supplementary Methods.
Ethics
The study was approved by the St. Johns National Academy of Health Sciences Institutional Ethical Committee (IEC115/2012, IEC119/2013, and IEC121/2015).
Biomarkers, ferritin, sTfR and Inflammation assays
Serum hepcidin was quantified using an enzyme-linked immunosorbent assay (Peninsula Labs, San Carlos, CA, USA). The hepcidin concentration was extrapolated from a standard curve generated by four parametric logistic regression in accordance with manufacturer instructions. ZPP/H was measured using a hematofluorometer (Aviv Biomedical, Lakewood, NJ, USA) calibrated with commer- cially available standards. Samples were measured in trip- licate and the average value obtained was expressed in μmole/mole heme. Due to a high baseline prevalence of inflammation in this population, we measured sTfR, an indicator of iron status that is not affected by the acute phase response. We calculated the sTfR/log ferritin index to accurately distinguish IDA from anemia of inflamma- tion.13 Serum ferritin and sTfR levels were both measured by paramagnetic particle chemiluminescent immunoassay
1992
haematologica | 2018; 103(12)
