
Page 148 - 2018_12-Haematologica-web
P. 148
L.V. Abruzzo et al.
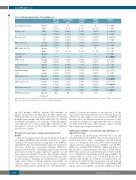
Table 2. Patients' characteristics of the validation set.
Sole +12
Sole del(13q) (n=9)
del(11q) (n=14)
Diploid (n=15)
Statistic
P
Age at diagnosis (years)
Gender, n (%)
Rai stage, n (%)
WBC count, n (%)
WBC count, (1x10⁹/L)
Prolymphocytes,
(% in PB) β2M, n (%)L
Immunophenotype,
n (%)
Light chain subtype, n (%)
IGHV status, n (%)
ZAP70 status, n (%)
CD38 expression, n (%)
Median 59
Range 39–82 38–70 40–81 38–78 P=0.6931
Male
Female 0-2 3-4 <150 G/L ≥150 G/L Median
7 (58%)
5 (42%) 11 (92%) 1 (8%) 10 (83%) 2 (17%) 73
χ2 = 4.2724
(n=12)
60
4 (44%)
5 (56%) 7 (78%) 2 (22%) 8 (89%) 1 (11%) 75
64
7 (87%)
1 (13%) 8 (100%) 0 (0%) 7 (87%) 1 (13%) 82 35–206
52
7 (47%)
8 (53%)
13 (87%)
2 (13%)
12 (80%)
3 (20%)
75
30–209
2
0–5
9 (60%) 6 (40%)
3 (20%)
12 (80%) 11 (73%) 4 (27%) 8 (57%) 7 (43%) 7 (54%) 6 (46%) 5 (33%) 10 (67%) NA
clinical or laboratory features to account for 4 of the diploid cases clustering with +12 cases. Because the genes selected for this analysis were based on ANOVA, and known only to be different between at least two of the cytogenetic subtypes, it is significant that the +12 cluster is clearly distinct from the other subtypes. Thus, +12 CLL has a unique gene expression profile.
Differences between +12 and del(13q), del(11q), or diploid CLL cases
To identify DE probes/genes between +12 cases and del(13q), del(11q), and diploid cases, respectively, we per- formed univariate t-tests. Comparing +12 and del(13q) cases, we identified 1181 DE probes representing 927 unique protein-coding genes, 41 ncRNAs, and 15 ESTs (FDR=1%, unadjusted P=0.000333). Thirty-one (2.6%) of the DE probes represent genes (e.g. BCL2, EIF4B, EIF4E, PIM1) that are known or predicted targets of miR-15a/miR- 16-1, within the 13q minimally deleted region (MDR).16 In addition, 365 out of 1181 (31%) of the DE probes are on chromosome 12; 364 out of 365 are over-expressed in +12 compared to del(13q) CLL. Comparing +12 and del(11q) cases, we identified 736 DE probes representing 583 unique genes, 19 ncRNAs, and 7 ESTs (FDR=5%, unad-
F = 0.4872
P = 0.2355
χ2 = 2.2464
P = 0.5229
χ2 = 0.4172
Range 8–364 41–193
P = 0.9367
F = 0.0388
P=0.9896
F = 8.7786
Median
Atypical
Typical
Kappa
Lambda
Mutated
Unmutated
Positive
711
1–10 0–11 0–5
P = 0.0001
Range
≤4 mg/L >4 mg/L
χ2 = 5.0531 P = 0.1679
9 (75%) 3 (25%)
6 (50%)
6 (50%) 8 (67%) 4 (33%) 3 (25%) 9 (75%) 4 (44%) 5 (56%) 5 (42%) 7 (58%) NA
an, 61.5 months), del(11q) (median, 62.5 months), or diploid cytogenetics (median, 66.2 months) (Figure 1B). With a median follow up of 146 months (95%CI: 144-157 months) from sample, and 181 months (95%CI: 168-200 months) from diagnosis, we found no statistically signifi- cant difference in overall survival (OS). Results for the cytogenetic subsets in the validation and combined datasets were similar.
Trisomy 12 cases have a unique gene expression profile
Next we performed univariate probe-by-probe analysis of variance (ANOVA) and identified 1263 probes repre- senting 1012 unique protein-coding genes, 40 ncRNAs, and 22 ESTs that were differentially expressed between at least two of the four cytogenetic subtypes (FDR=1%; unadjusted P=0.00385). Clustering samples using all 1263 probes showed that the gene expression signature of +12 cases (green) was distinct from the other subtypes (Figure 2). (See Online Supplementary Figure S1 for principal com- ponents analysis.) Similarly, most del(13q) cases formed a single cluster (blue), as did the del(11q) cases (pink). In contrast, diploid cases were found in three clusters, admixed with a subset of del(13q) cases. We identified no
Negative
9 (100%) 0 (0%)
3 (43%)
4 (57%) 4 (57%) 3 (43%) 8 (100%) 0 (0%)
0 (0%) 7 (100%) 0 (0%) 7 (100%) NA
5 (63%) 3 (37%)
0 (0%)
8 (100%) 7 (87%) 1 (13%) 1 (13%) 7 (87%) 6 (86%) 1 (14%) 6 (75%) 2 (25%) NA
χ2 = 7.140 P = 0.06757 χ2 = 1.8725 P = 0.5993 χ2 = 15.432 P = 0.0015 χ2 = 10.681 P = 0.0136 χ2 = 9.137 P = 0.0275 NA
≥30%
<30%
Mutated
Unmutated
NOTCH1 status, n (%)
WBC: white blood cell count; β2M: β2 microglobulin; n: number; PB: peripheral blood. *Continuous variables were evaluated with analysis of variance (F-test); categorical vari-
ables were evaluated with a χ2 test. Values in bold are statistically significant.
2072
haematologica | 2018; 103(12)
