
Page 147 - 2018_12-Haematologica-web
P. 147
Trisomy 12 CLL
Table 1. Patients' characteristics of the discovery set. Sole +12
Sole del(13q) (n=40)
Sole del(11q) (n=10)
Diploid (n=32)
Statistic P*
Age at diagnosis (years)
Gender, n (%)
Rai stage, n (%)
WBC count, n (%)
WBC count, (1x10⁹/L)
Median 57
Range 51–74 27–70 48–80 34–77 P=0.0727
(n=15)
55
30 (75%)
10 (25%) 30 (75%) 10 (25%) 33 (85%) 6 (15%) 110
57
9 (90%)
1 (10%) 10 (100%) 0 (0%) 10 (100%) 0 (0%) 57
52
24 (75%)
8 (25%) 22 (69%) 10 (31%) 26 (81%) 6 (19%) 71
F = 2.4008
Male
Female 0-2 3-4 <150 G/L ≥150 G/L Median
12 (80%)
3 (20%) 12 (80%) 3 (20%) 12 (75%) 3 (25%) 77
χ2 = 1.1993 P = 0.7532 χ2 = 4.2644 P = 0.2343 χ2 = 2.3084 P = 0.509 F = 0.8942
Range 23–364 9–319 30–135 21–372 P=0.4473 Median 6 5 3 5 F = 2.0346 (%inPB) Range 1-22 0–19 0–18 0–13 P=0.1147
Prolymphocytes,
β2M, n (%)L Immunophenotype,
n (%)
Light chain subtype, n (%)
IGHV status, n (%)
ZAP70 status, n (%)
CD38 expression, n (%)
NOTCH1 status, n (%)
≤4 mg/L >4 mg/L Atypical Typical Kappa Lambda Mutated Unmutated Positive Negative ≥30% <30% Mutated Unmutated
12 (80%) 3 (10%) 7 (45%) 8 (55%) 8 (55%) 7 (45%) 5 (33%) 10 (67%) 8 (62%) 5 (38%) 5 (33%) 10 (67%) 6 (40%) 9 (60%)
30 (77%) 9 (23%) 5 (16%) 33 (87%) 17 (45%) 21 (55%) 24 (60%) 16 (40%) 14 (40%) 21 (60%) 3 (8%) 35 (92%) 1 (3%)
34 (97%)
6 (60%) 4 (40%) 3 (30%) 7 (70%) 8 (80%) 2 (20%) 0 (0%) 10 (100%) 3 (30%)
7 (79%)
4 (40%)
6 (60%) 0 (0%) 10 (100%)
20 (63%) 12 (37%) 6 (19%) 26 (81%) 24 (75%) 8 (25%) 7 (22%) 25 (78%) 17 (65%) 9 (35%) 9 (28%) 23 (72%) 4 (13%) 26 (87%)
χ2 =2.9538 P = 0.3988 χ2 = 7.5932 P =0.0552 χ2 = 8.633 P = 0.0346 χ2 = 18.154 P = 0.0004 χ2 =5.4413
P = 0.1422 χ2 = 8.088 P = 0.0442 χ2 = 15.076 P = 0.0017
WBC: white blood cell; PB: peripheral blood; β2M: serum β2 microglobulin; n: number. *Continuous variables were evaluated with analysis of variance (F-test); categorical vari- ables were evaluated with a χ2 test. Values in bold are statistically significant.
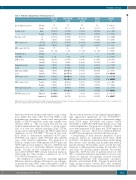
differences between subtypes with respect to age at diag- nosis, gender, Rai stage, white blood cell (WBC) count, prolymphocyte percentage, serum beta-2 microglobulin (β2M), or ZAP-70 expression at the time samples were obtained (Table 1). The association between +12 and atypical immunophenotype (moderate to strong expres- sion of at least two markers including CD22, CD79b, strong surface immunoglobulin, and FMC7) approached significance (χ2 test, P=0.0552).4,15 Trisomy 12 cases were more likely to demonstrate unmutated IGHV genes (P=0.0004) and express CD38 (P=0.044) than del(13q) cases, with statistical significance. The proportion of del(11q) or diploid cases with unmutated IGHV genes and CD38 expression was similar to +12 cases. ZAP70 protein expression was not statistically different between the groups. Trisomy 12 cases contained 6 out of 15 (40%) cases with NOTCH1 PEST domain truncation mutation. Collectively, the other subtypes contained 5 out of 75 (7%) NOTCH1-mutated cases.
The validation set contained no statistically significant differences between subtypes with respect to age at diagno- sis, gender, Rai stage, WBC count, serum β2M, or ZAP-70 expression at the time samples were obtained (Table 2).
The association between +12 and atypical immunopheno- type approached significance (χ2 test, P=0.06757).4,15 Trisomy 12 cases were more likely to demonstrate unmu- tated IGHV genes (P=0.0015), and express ZAP70 (P=0.0136) or CD38 (P=0.0275) than del(13q) cases, with statistical significance. The proportion of del(11q) or diploid cases with unmutated IGHV genes and CD38 expression was similar to +12 cases. There was no statistical difference in ZAP70 protein expression between the three groups.
Corresponding to their increased frequency of poor prognostic features (i.e. unmutated IGHV status, CD38 positivity), +12 patients required treatment earlier during their disease course (median, 22.5 months) than del(13q) patients (median, 27.5 months), and at around the same timepoint as diploid patients (median, 23.1 months), but later than sole del(11q) patients (median, 9.6 months) (Figure 1A). All 97 discovery set patients and 22 out of 44 (50%; treatment information unavailable for 6 cases) vali- dation set patients subsequently received front-line chemoimmunotherapy with fludarabine, cyclophos- phamide, and rituximab (FCR). Trisomy 12 patients had longer progression-free survival (PFS) after treatment (median, >150 months) than patients with del(13q) (medi-
haematologica | 2018; 103(12)
2071
