
Page 130 - 2018_12-Haematologica-web
P. 130
A.A. Mensah et al.
qPCR analysis of SU-DHL-2 cells treated with OTX015, we observed decreased binding of BRD4 to the 5’ region of PRMT5 (Figure 3B). The decrease in PRMT5 expres- sion following OTX015 treatment was, therefore, likely due to a reduced association of BRD4 to the 5’ regulatory region of PRMT5. Additionally, DNAse hypersensitivity sites and H3K27 acetylation, both marks of active tran- scription, were enriched at the BRD4 binding site in
A
PRMT5 (data not shown). As PRMT5 and miR-96-5p regu- late each other in a negative feedback loop, we tested for binding of PRMT5 to the promoter of miR-96-5p. OTX015 treatment led to reduced recruitment of PRMT5 to the miR-96-5p promoter (Figure 3C) indicating that upregulation of miR-96-5p in BET inhibitor-treated cells was mediated through downregulation of PRMT5 (Figure 3D).
B
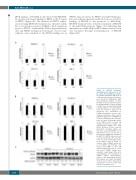
Figure 2. OTX015 modulates microRNA-96-5p expression in dif- fuse large B-cell lymphoma models. (A) OTX015 upregulates miR-96-5p in a time-dependent manner. Two germi- nal center B-cell (GCB)-diffuse large B-cell lymphoma (DLBCL) cell lines (DOHH-2, OCI-LY-1) and two activated B-cell (ABC)-DLBCL cell lines (SU-DHL- 2, HBL-1) were treated with dimethyl sulfoxide (DMSO) or 500 nM OTX015 for 4, 24, and 48 h. Expression of miR-96-5p was determined by TaqMan quantitative reverse tran- scription polymerase chain reaction (qRT-PCR). Expression of RNU6B was used for normalization. For each time- point, the mean fold-change relative to the DMSO control is shown. (B) OTX015 treatment of DLBCL cells downregulates PRMT5. Two GCB- DLBCL (DOHH-2, OCI-LY-1) and two ABC-DLBCL (SU-DHL-2, HBL-1) cell lines were treated with DMSO or 500 nM OTX015 for 4, 24, and 48 h. Expression of PRMT5 was determined by qRT-PCR. GAPDH expression was used for normalization. For each time- point, the mean fold-change relative to the DMSO control is shown. (C) OTX015 reduces PRMT5 protein lev- els in DOHH-2 and SU-DHL-2 cells treated with DMSO or 500 nM OTX015. GAPDH was used as a load- ing control. PRMT5 signals were quantified using ImageJ (http://rsb- web.nih.gov/ij/) and normalized to GAPDH signals. Representative images of two independent Western blot analyses are shown. The graphs show the mean of three independent experiments. **P<0.01. Error bars denote the standard error.
C
2054
haematologica | 2018; 103(12)
