
Page 128 - 2018_12-Haematologica-web
P. 128
A.A. Mensah et al.
OCI-LY-1 DLBCL cells treated with OTX015 (Online Supplementary Table S1). The same pathways were predict- ed to be affected based on the modulated miRNAs in DOHH-2 and SU-DHL-2 cells treated with OTX015 (Online Supplementary Table S1). These signaling pathways and processes were similar to those we previously observed when analyzing the gene expression profiles of OTX015-treated DLBCL cells.15
BRD4 binds to the upstream regulatory regions of multiple miRNAs
To further study the role of BET proteins in miRNA reg- ulation, we took advantage of two publicly available ChIP-sequencing datasets obtained in the ABC-DLBCL cell line HBL-1 (SRP043524)23 and in the GCB-DLBCL cell line OCI-LY-1 (SRP022129),22 both treated with the BET inhibitor JQ1 or DMSO alone. Analysis of these datasets revealed that half of the regions bound by BRD4 were in intronic and intergenic regions where miRNAs are often located.48 We detected 794 miRNAs with at least one BRD4-binding event within their regulatory regions in ABC-DLBCL HBL-1 cells and 757 in the GCB-DLBCL OCI-LY-1 cell line (Online Supplementary Table S2).
To determine whether BRD4 binding was associated with the expression of miRNA genes we profiled miRNA expression levels in a panel of 35 lymphoma cell lines using the Nanostring nCounter (Online Supplementary Table S3). Comparison of miRNA expression levels and BRD4 binding sites demonstrated that BRD4 peaks were more prevalent in the proximity of expressed miRNAs than non-expressed miRNAs (P<0.001) and were positive- ly correlated with miRNA expression levels (Figure 1A). When we compared BRD4 binding in the presence or absence of the BET inhibitor JQ1, we identified 707 miRNAs with decreased BET bromodomain binding after exposure to the BET inhibitor in ABC-DLBCL HBL-1 cells and 348 in GCB-DLBCL OCI-LY-1 cells (Online Supplementary Table S2). Downregulation of miR-92a-1-5p and miR-155p expression following BET inhibitor-mediat- ed reduction of BRD4 binding was also confirmed by qRT- PCR analysis (Figure 1B).
BET inhibition mediates upregulation of miR-96-5p by downregulating PRMT5 expression
The observed upregulation of the tumor suppressor miR-96-5p after exposure of DLBCL cell lines to OTX015 could not be explained by a direct BRD4-mediated effect of the BET inhibitor on the miRNA promoter. Thus, the miRNA profiling results were further validated by qRT- PCR in two GCB-DLBCL cell lines (DOHH-2, OCI-LY-1) and two ABC-DLBCL cell lines (SU-DHL-2, HBL-1) treat- ed with OTX015 for 4, 24 and 48 h. For DOHH-2, SU- DHL-2 and HBL-1 cells, there was a time-dependent upregulation of miR-96-5p. For OCI-LY-1 cells, miR-96-5p was similarly upregulated at all three time points (Figure 2A).
In lymphomas, miR-96-5p expression is regulated as part of a negative feedback loop with the protein arginine methyltransferase, PRMT5.39 Overexpression of PRMT5 mediates transcriptional repression of this miRNA via symmetric dimethylation of histones H3 and H4 in the promoter of miR-96-5p. Conversely, binding of miR-96-5p to the 3’ untranslated region of PRMT5 inhibits its transla- tion.39,49 We hypothesized that the upregulation of miR-96- 5p observed in OTX015-treated DLBCL cells could be due
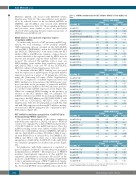
Table 1. miRNAs modulated by the BET inhibitor OTX015 in four DLBCL cell lines.
OCI-LY-1 (GCB-DLBCL)
4 hours
24 hours
microRNA_ID log2FC
hsa-miR-639 -1.38
hsa-miR-204-5p ^ -0.46 hsa-miR-6511a-5p -0.43 hsa-miR-106a-5p+hsa-miR-17-5p -0.33 hsa-miR-3613-5p 0.30 hsa-miR-1254 0.96 hsa-miR-760 1.07 hsa-miR-221-5p 1.46 hsa-miR-498 1.84 hsa-miR-487b-3p ^ -0.02 hsa-miR-16-5p 0.07 hsa-miR-182-5p 0.24 hsa-miR-3136-5p 0.43 hsa-miR-3605-3p 0.48
P value 0.005
n.s. n.s. n.s. n.s. 0.031 0.012 0.004 0.013 n.s. n.s. n.s. n.s. n.s.
log2FC
-0.29
-1.61 -1.38 -0.95 -3.30 0.73 0.84 -0.07 -0.48 1.58 1.22 0.95 1.51 1.47
P value n.s.
0.048 0.034 0.035 <0.001 n.s. n.s. n.s. n.s. 0.016 0.012 0.025 0.013 0.014
HBL-1 (ABC-DLBCL)
4 hours
24 hours
microRNA_ID log2FC
hsa-miR-204-5p ^ -1.59
hsa-miR-133a-5p -1.13 hsa-miR-155-5p -0.67 hsa-miR-580-3p -0.22 hsa-miR-92a-1-5p ^ -0.45 hsa-miR-487b-3p ^ 1.59 hsa-miR-652-5p 2.08 hsa-miR-191-5p 0.16 hsa-miR-96-5p ^ 0.41 hsa-miR-433-3p 0.49 hsa-miR-582-3p 0.72
P value 0.011
0.020 n.s. n.s. n.s. 0.007 <0.001 n.s. n.s. n.s. 0.059
log2FC
-0.58
0.26 -1.11 -1.11 -1.93 -0.32 0.56 1.17 0.99 1.75 1.88
P value n.s.
n.s. 0.017 0.017 0.009 n.s. n.s. 0.007 0.023 0.014 0.001
DOHH2 (GCB-DLBCL)
4 hours log2FC P value
-0.44 0.039
-0.37 0.045 -0.32 n.s. 0.63 0.036
0.36 0.049
0.07 n.s. 0.61
0.01 n.s. 0.39 0.0415
SU-DHL-2 (ABC-DLBCL)
8 hours
microRNA_ID
hsa-miR-196a-3p
hsa-miR-21-3p hsa-miR-92a-1-5p ^ hsa-miR-630 hsa-miR-935 hsa-miR-1181 hsa-miR-96-5p ^
microRNA_ID
hsa-miR-92a-1-5p ^
P value n.s.
8 hours
log2FC
0.29
-0.48 -0.52 -0.33 1.45
n.s. 0.0177 n.s. n.s. 0.0086
4 hours log2FC P value
-0.78 0.004
log2FC
-2.01
P value 0.004
0.043 0.011 0.025 0.015
hsa-miR-29b-1-5p -0.25 n.s. -0.46
hsa-miR-765 hsa-miR-1246 hsa-miR-345-5p
0.39 0.102 0.48 0.23 n.s. 0.64 0.13 n.s. 0.58
^:modulated in more than one cell line; n.s., not significant. GCB: gerinal center B-cell; ABC: acti- vated B-cell; DLBCL: diffuse B-cell lymphoma; FC: fold change.
2052
haematologica | 2018; 103(12)
